Report Published July 2, 2025 · 10 minute read
What’s the Value of a Master’s Degree?
Graduate education is the fastest-growing segment of US higher education. While undergraduate enrollment has increased by 30% over the past two decades, graduate enrollment increased by more than 45% over the same period.1 This rapid growth in enrollment has been accompanied by an even faster increase in federal student loans disbursed annually to graduate students, which has more than doubled in real terms since 2000-01 (from just under $19 billion to over $40 billion in 2023-24).2 The increase in graduate student debt has attracted policy concern and proposals for reform. But far less attention has been given to the other side of the equation: what financial returns do students earn from their graduate degrees?
As policymakers aim their sights more squarely on graduate program quality and accountability, they may be surprised at the relatively limited evidence base on the earnings gains for graduate degrees. Of course, students may enroll in graduate education for reasons beyond earnings. Still, the vast majority of prospective graduate students cite earnings potential as an important or very important consideration in their decision, and these outcomes are particularly important for understanding the implications of rising graduate student debt.3 Understanding how earnings gains vary across fields, students, and economic conditions is critical for informed policymaking.
Using two decades of administrative data from Ohio’s public colleges and universities, we compare master’s degree completers’ earnings before and after graduate school. On average, earning a master’s degree increases earnings by 14%, though returns vary by field. Women see higher returns than men, and white graduates outpace Black peers. Graduating into a recession reduces earnings gains, but despite these differences, returns remain positive across all groups and time periods, reinforcing the value of master’s degrees from public institutions.4
Narrative
While numerous academic studies have rigorously estimated the causal returns to all kinds of undergraduate education, rigorous research on returns to graduate programs has lagged behind.5 The dearth of research is increasingly consequential: graduate students now account for nearly half of federal student loans disbursed annually. Yet we have limited rigorous evidence to help students, institutions, and policymakers assess the value of these investments.6
A handful of recent studies, including our own, have begun to address this gap, and the emerging evidence shows that graduate education can offer strong economic gains, but these gains are highly field- and sector-specific. One such study uses the US Department of Education’s 2022 Program Performance Data to look at typical earnings outcomes by graduate program and sector.7 While master’s degree holders earn substantially more than bachelor’s degree holders on average, earnings vary widely depending on the program and sector. Graduates from certain programs—especially in for-profit institutions—often take on high levels of debt without seeing a corresponding boost in earnings, meaning their investment does not always pay off. Nearly one-quarter (24%) of for-profit graduate programs leave their graduates with high debt burdens relative to earnings, compared to 12% of programs at private non-profit institutions and only 2% of programs at public institutions. Although there are concerns about new entrants into the graduate education market due to institutions’ ability to charge higher tuition, a new study provides some reassurance that newer graduate programs have equal or lower debt burdens than more established similar programs.8
Using administrative data on public and non-profit institutions in Texas, researchers found that six-year completion rates for graduate programs are similar to undergraduate rates—around 68% overall for 2013 entrants, but with variation across fields and institutions.9 Education–the largest degree field in their sample–had the lowest completion rates (60%). Still, they find substantial earnings gains in most fields, with generally larger gains for completers but large gains even for non-completers.10
Research has also highlighted the importance of comparing the earnings of completers and non-completers carefully. Simply looking at average earnings can be misleading, since fields like engineering or business that already attract higher-earning undergraduates can appear to offer larger graduate payoffs than they actually do. In contrast, fields like social work that have a higher concentration of lower-paid undergraduates may show smaller earnings gains than they actually yield. Recent work avoids this issue by comparing earnings for graduate degree completers with the same combinations of undergraduate major and graduate field of study before and after earning their degree. Researchers found strong positive earnings returns for most fields of study, ranging from around 15–25%.11 A few fields yielded minimal returns (as among them certain arts and humanities degrees), while others yielded much larger than average returns (such as law and medicine).
Our research contributes to this emerging evidence using administrative data from Ohio over a longer time span, enabling us to examine how outcomes vary by field of study and how they have changed over time.
The Value of a Master’s Degree from Ohio Public Institutions
Public institutions play a crucial role in graduate education, conferring nearly half of all master’s degrees in the United States.12 Similar to national trends, about two-thirds of master’s degrees in our sample are concentrated in specific fields, with education (47%) and business (20%) making up the largest shares. However, compared to graduate students at public institutions nationally, our sample has a higher share of education degrees (47% vs. 38%). Additionally, students in our sample complete their master’s degrees at a younger age (32 vs. 34 nationally); there’s also a higher representation of white students (84% vs. 72%).13
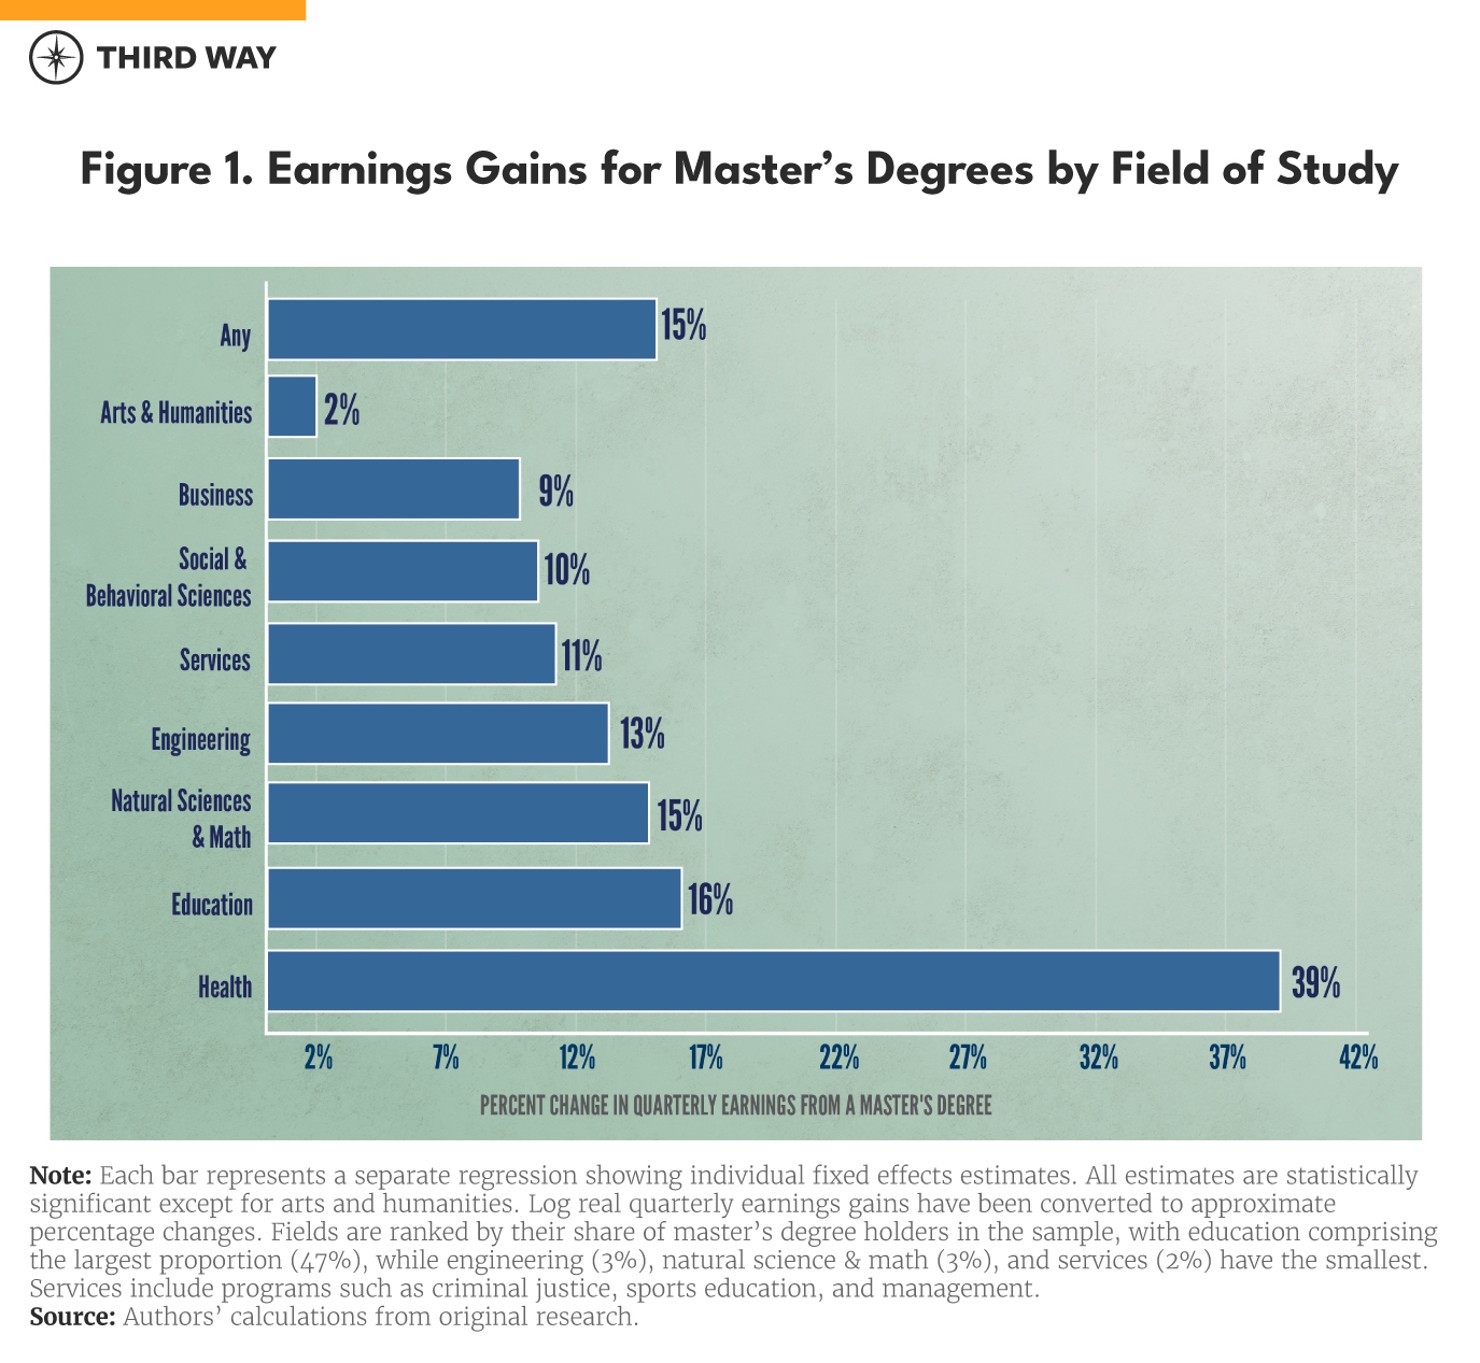
Our recent analysis, using data from Ohio’s public institutions, tracks individuals’ earnings before and after completing a master’s degree to estimate earnings gains over time. On average, we estimate that earning a master’s degree from a public institution in Ohio increases quarterly earnings by 15% (about $1,600), relative to individuals’ earnings prior to graduate enrollment ($11,433).14 However, the returns vary significantly across fields. Health fields see the largest earnings gains, boosting earnings by 39%, while arts and humanities degrees yield little to no earnings increase. Fields such as education, business, and social & behavioral sciences —including programs like social work and public administration— fall in between, with returns ranging from 9% to 16%. Our findings also reveal disparities in returns by gender and race, with women (16%) experiencing higher average gains than men (9%), and white graduates (15%) seeing larger returns compared to Black graduates (11%). Differences in fields of study explain some of the variation in returns across demographic groups, but they do not fully account for disparities in earnings gains by race and gender.
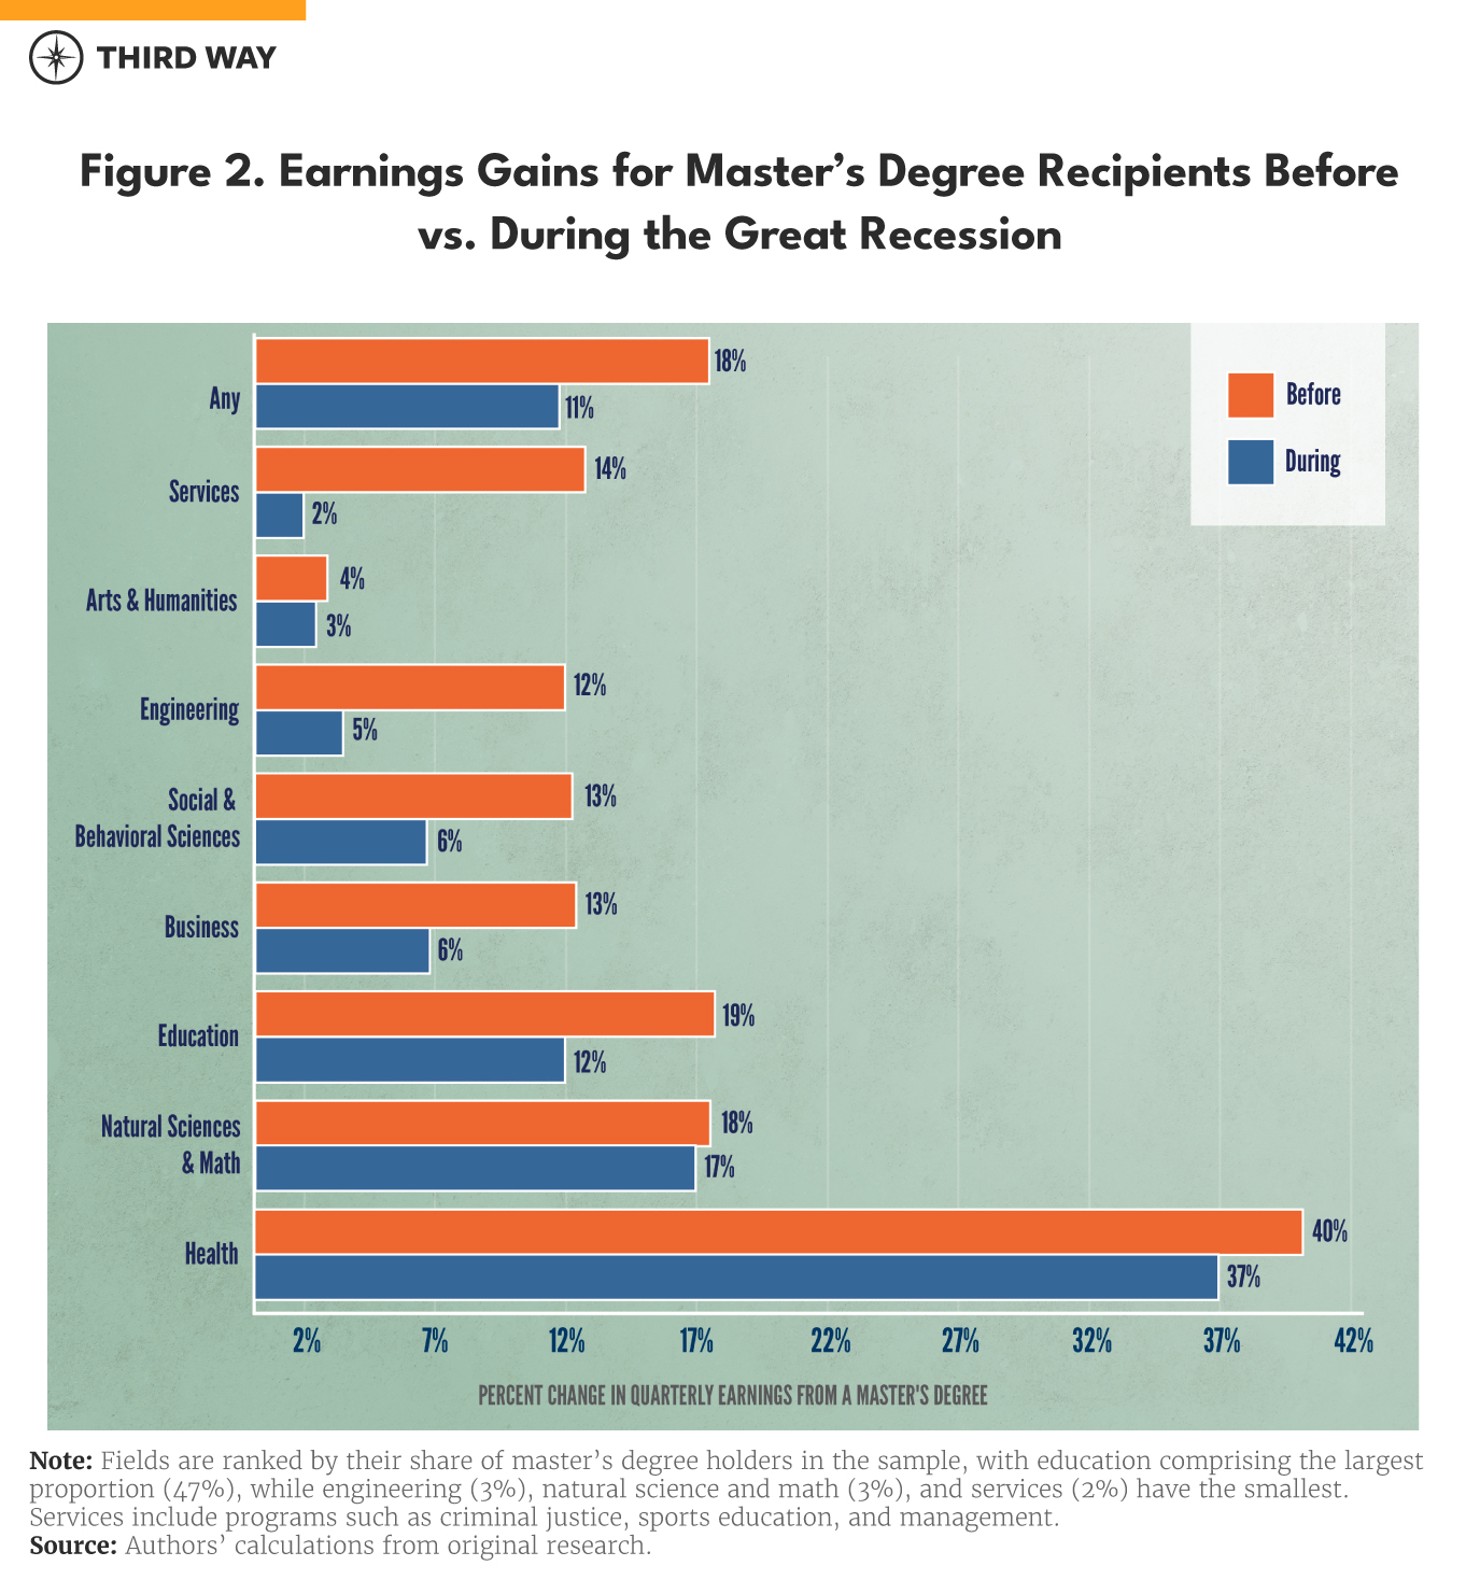
Economic conditions at graduation influence the value of a master’s degree, though earnings improvements persist even in weaker labor markets. Comparing returns among students who graduated before and during the Great Recession of 2008–09, we find that while returns remained substantial and positive in most fields, graduates who completed their degrees during the recession saw an average earnings gain of 11%, or about 80% of the gains experienced by those who graduated before the downturn. We also find that the recession effect—where graduates see smaller but still positive earnings gains—varies significantly by field of study. For instance, returns to master’s degrees in health barely budged during the recession, while the returns for education graduates fell by about a third, and the returns for business or social and behavioral sciences graduates fell by about half.
These findings highlight how both fields of study and economic conditions play a key role in shaping earnings and job prospects for master’s degree graduates. At the same time, they show that in the most common master’s degree fields (education, business, social and behavioral sciences, and health, covering 87% of degrees earned in our sample), earnings gains remained strong even for those graduating into a historically weak economy. It is nonetheless important to note that we can only estimate these returns for public master’s degree graduates who worked before entering graduate school.
Policy Implications
Graduate education plays an increasingly central role in the US higher education system, with enrollment trends reflecting its importance for career advancement and economic mobility. As more students pursue master’s degrees, federal policymakers must recognize that graduate education is no longer an exclusive pursuit but a common investment in the labor market. Given its rising importance, it is crucial to develop a comprehensive federal policy approach that ensures better data transparency and strong returns on investment for both students and taxpayers.
- Federal policymakers should consider how to ensure graduate education delivers value for both students and taxpayers. With more students pursuing graduate degrees than ever, it is now considered a typical educational investment—not something only privileged students do. Almost half of all bachelor’s degree graduates nationally enroll in a graduate program within 10 years, including 44% of first-generation college graduates, 47% of graduates who received a Pell Grant, and 58% of Black college graduates.15 Overall, 14% of adults aged 25 or older hold a graduate degree. When the Higher Education Act was passed in 1965, fewer than 10% of the same age group had a bachelor’s degree.16 This suggests that the time is ripe for the development of a strategic federal policy approach around graduate education that protects access, ensures ROI for students and taxpayers, and increases accountability while protecting professions that deliver high social value.
- Federal policymakers should invest in better data systems to track emerging trends and evaluate outcomes in graduate education across sectors—not just public institutions. While the available research indicates that graduate degree completers from public institutions are doing well on average, only 45% of graduate students enroll at public institutions.17 At the undergraduate level, federal data have been essential for tracking outcomes beyond the public institutions covered in most state administrative datasets. To address the gaps at the graduate degree level, policymakers should make existing federal data on graduate degree students’ post-program employment, earnings, and loan repayments more accessible for researchers and prospective students. They might also consider expanding federal survey data collections to include a “Beginning Graduate Student” longitudinal survey linked to federal data on employment, earnings, and student loan repayment, or expanding IPEDS data elements to include more detail on graduate degree programs. In light of recent disruptions to federal data infrastructure, these steps are critical to preserving the ability to track trends and ensure accountability as graduate education continues to grow.
- Federal policymakers should take differences in earnings gains by field into account when designing policies that impact graduate education. Our research shows that public sector master’s degree graduates experience earnings gains of around 15% on average. While these earnings gains vary across fields, the typical graduate from the two most common fields—education and business, representing about two-thirds of master’s degree completers in our sample and nationally—have strong earnings gains of 15% and 9%, respectively. While arts and humanities fields indicate minimal earnings gains, these graduates represent fewer than 4% of public master’s degree completers (both in our sample and nationally).
Methodology
Our empirical analysis draws on a rich dataset linking student records from Ohio’s public colleges to state-level earnings data. We track over a decade of earnings for individuals who completed a master’s degree between 2000 and 2009, allowing us to estimate long-term returns. We employ an individual fixed effects approach that compares an individual’s post-degree earnings to their own earnings prior to graduate enrollment.18 For each individual, we use quarters of earnings within six quarters before the first graduate enrollment as pre-earnings, and quarters of earnings within 10 years after the completion of the master’s degree as post-earnings.
To approximate gains for full-time employed individuals and avoid confounding the estimates with out-of-state mobility, labor force dropout, and part-time employment, only earnings higher than the state’s minimum wage earned at an age older than 22 are used in the estimation. To address concerns that post-degree earnings may increase for reasons other than the degree itself, we control for time-varying factors such as age and county-level unemployment. Finally, we control for any differences in the expected time trends in earnings based on race/ethnicity, gender, field of study, age, and cohort of entry into graduate school.
More detailed methodological information can be found here.
