Memo Published August 10, 2011 · Updated August 10, 2011 · 7 minute read
What it Takes to Win
Senator Russ Feingold won 89% of liberals and 58% of moderates and still lost his Wisconsin race.1
Democrats and Republicans have the same goal in elections—winning at least 50%-plus one of the overall vote. But what it takes to reach that threshold is very different for each party. To be sure, both Democrats and Republicans need to excite and motivate their respective wings. But the real challenge for each party is winning enough of the middle—those self-identified, ideological moderates who put candidates over the top. This memo, based in part on the research and analysis in William Galston and Elaine Kamarck’s paper, The Still-Vital Center: Moderates, Democrats, and the Renewal of American Politics, explains that for the Democratic Party, the bar is much higher.2
Based on an analysis of exit polls dating back three decades, we find the following:
- Moderates are big and influential. They represented the largest share of the electorate in 13 of the last 14 congressional election cycles.3
- Democrats need to win a supermajority of moderates in order to win a presidential or typical Senate race.4
- Liberals are not the numerical base of the Democratic Party. Most people who vote for Democrats call themselves moderates. By contrast, most people who vote for Republicans call themselves conservative.5
In general, parties appeal to their ideological wings because that is where the most active and fervent support resides. Republicans can accomplish this task much more easily because they need to win far fewer moderates to gain office. For Democrats, however, the liberal/moderate marriage is more complicated. The liberal side is the most active; the moderate side is more numerous. Looking forward to 2012, Democrats need to look for ways to keep moderates at the altar and woo this less vocal—but far more substantial—block of voters. This electoral reality should motivate Democrats to embrace moderates as a part of their coalition and support moderate policies in the major debates in Washington.
Moderates are big and influential.
Over the past three decades, the ideological composition of the electorate has remained remarkably stable. According to exit polls, in 13 of the last 14 congressional races in which data is available, moderates were the largest slice of the electorate with only the 2010 race breaking this trend.
Table #1 - Ideological Composition of the Electorate, 1980-2010 (Sources 6-196)

In most contested elections, each party wins the vast majority of their ideological bases. President Obama, for example, won 89% of self-identified liberals in 2008; Senator McCain won 78% of conservatives.7 Even in the Republican wave election of 2010, congressional Democrats won 90% of liberals.8 But winning these ideological extremes is never enough. Because of the sheer number of moderates in our country, building a coalition that includes a broad swath of moderate voters has been an essential task for both Republicans and Democrats in every recent national election. But this task is all the more crucial for Democrats, since liberals represent only about one-fifth of the electorate. Even a 5% decline in moderate support can have huge consequences.
The big shift between 2008 and 2010 was among moderates—who swung from 60% support for Obama in 2008 to 55% for congressional Democrats in 2010,9 and dropped from 44% to 38% as a share of the overall electorate.10 This works out to a combined loss of 4.98 million voters for Democrats among self-identified moderates.11 In question is whether the dramatic upheaval of the 2010 election is a temporary or permanent ideological shift. If this shift holds, the President—and all Democrats—may face an uphill climb in 2012.
Democrats cannot win without a supermajority of moderates.
Regardless of whether the red shift from 2008 to 2010 is permanent, Democrats have to win an enormous number of moderates to succeed in national races and typical state and congressional battles. The last Democrat to win the Presidency with less than a 60% supermajority of the moderate vote was Jimmy Carter in 1976.12 By contrast, the last Republican President to win even a simple majority of moderate voters was Ronald Reagan in 1984. And even in his 49-state landslide over Vice President Walter Mondale, President Reagan earned a smaller share of moderates (53%) than Senator John Kerry did in his loss to President George W. Bush in 2004 (54%).13
As Table #2 shows, Obama carried 60% of the moderate vote in 2008. If the ideological breakdown of the electorate remains the same in 2012 as it was in 2010, 60% will not be enough to re-elect President Obama.
Table #2 - Democratic Presidential Candidate Share of the Moderate Vote14
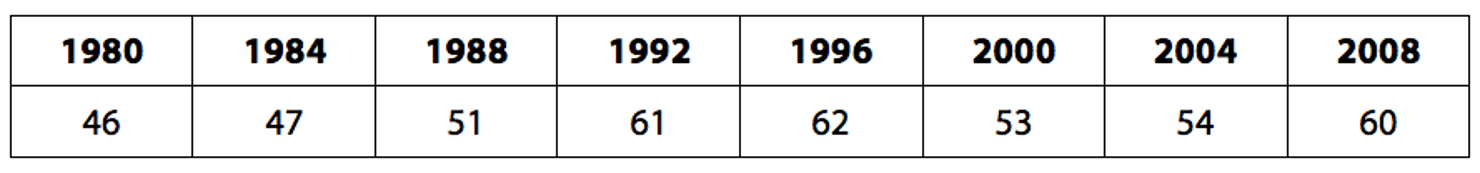
Table #3 compares the performance of Barack Obama with John Kerry. Senator Kerry would have needed to win over 95% of the liberal vote to defeat President George W. Bush—a significantly higher percentage than Obama scored among liberals. Alternatively, if he had improved from 54% to 59% among moderates he would have been president.15
Table #3 - Ideological Composition of the Democratic Presidential Vote16

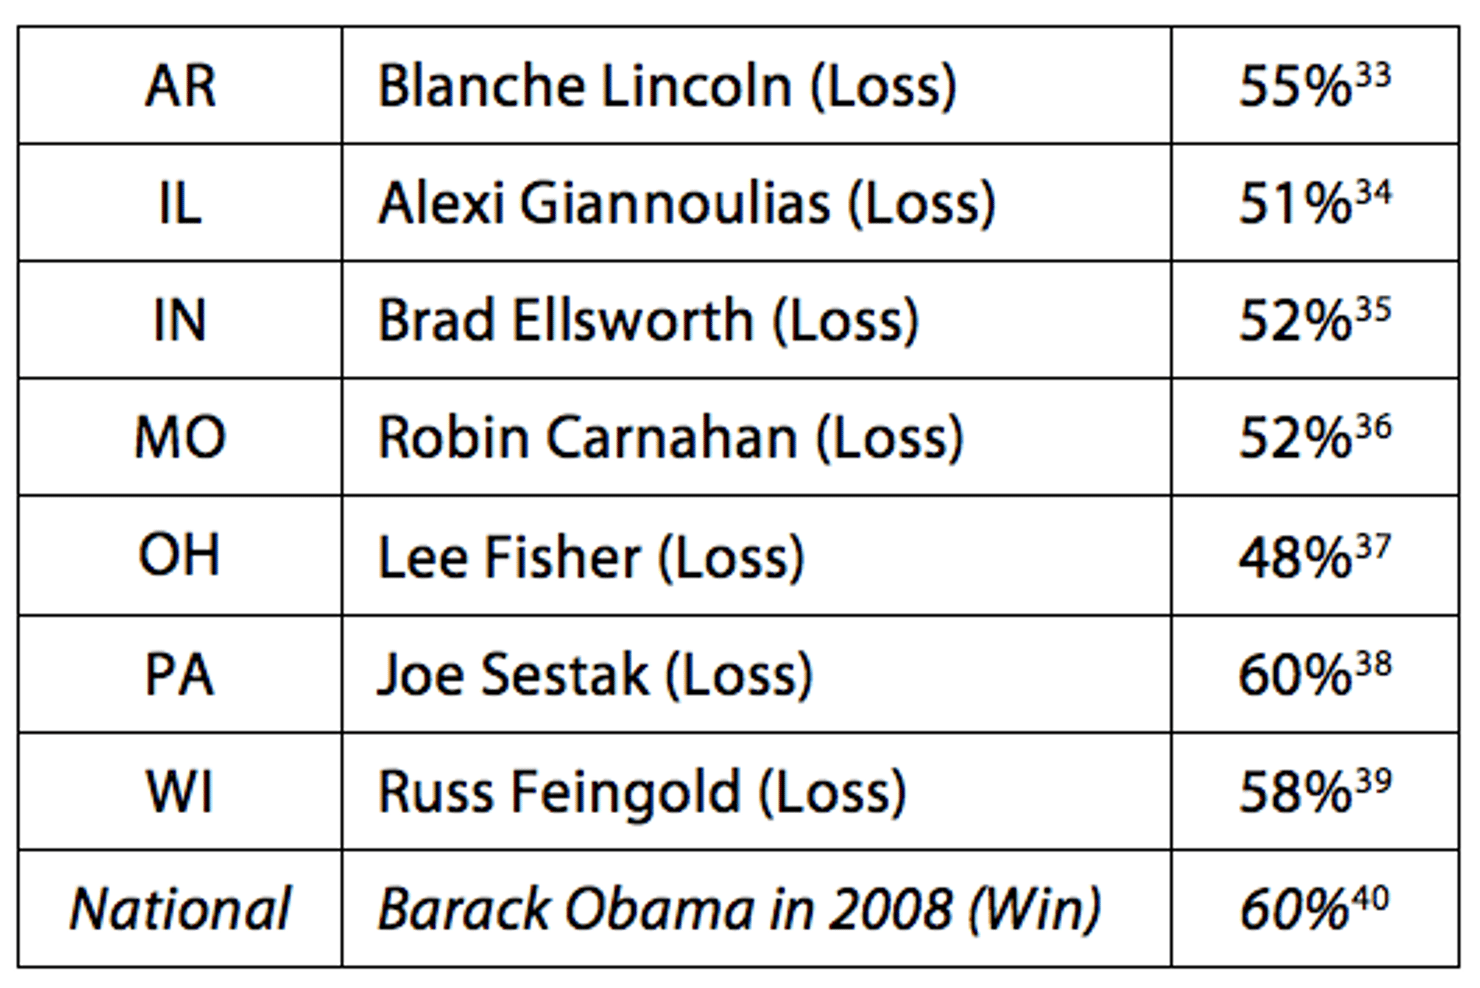
This pattern holds true in midterm elections as well. Incumbent Democratic Senator Russ Feingold lost his seat in 2010 because he failed to win a sufficient percentage of moderates. If he had secured every single liberal vote in Wisconsin, he still would have lost re-election. However, if he had improved his performance among moderates by only 5.5 points, he could have won the race.17 Across the board, Democratic House candidates won 55% of moderates in 2010—a seemingly strong number that belies the level of support Democrats need in the center to remain competitive. Comparatively, Democrats won moderate supermajorities in 2008 (61%)18 and 2006 (60%).19 Most 2010 Democratic Senate candidates, like Feingold, underperformed compared to President Obama’s success in recruiting moderates, as Table #4 shows:
Table #4 - Democratic Performance with Moderates in Key Senate Races in 2010 (Sources 33-4020)
At the congressional and presidential levels, it has become essential for Democrats to win a heavy majority or even a supermajority of moderate voters.
Moderates are the real, numerical Democratic base.
The Republican Party base in terms of money, enthusiasm, and votes is made up of self-identified conservatives. This is one of the reasons the Party continually moves to the right and rarely has deep internal divisions. There is a consistency in all its major cogs of operation and support.
The Democratic base is different and contradictory. On the one hand, the donor and organizing base is liberal. On the other, the numbers show that moderates form a larger portion of the Democratic Party than liberals. Perhaps that is why there is a constant battle over which ideas will dominate the Party—liberal or moderate.
Table #5 illustrates the ideological breakdown for both parties in the last three presidential elections; in each year, moderates had a dominant position among Democrats.
Table #5 – Why Moderates Matter: Ideology of Voters in Recent Presidential Elections
(Sources 41-4321)
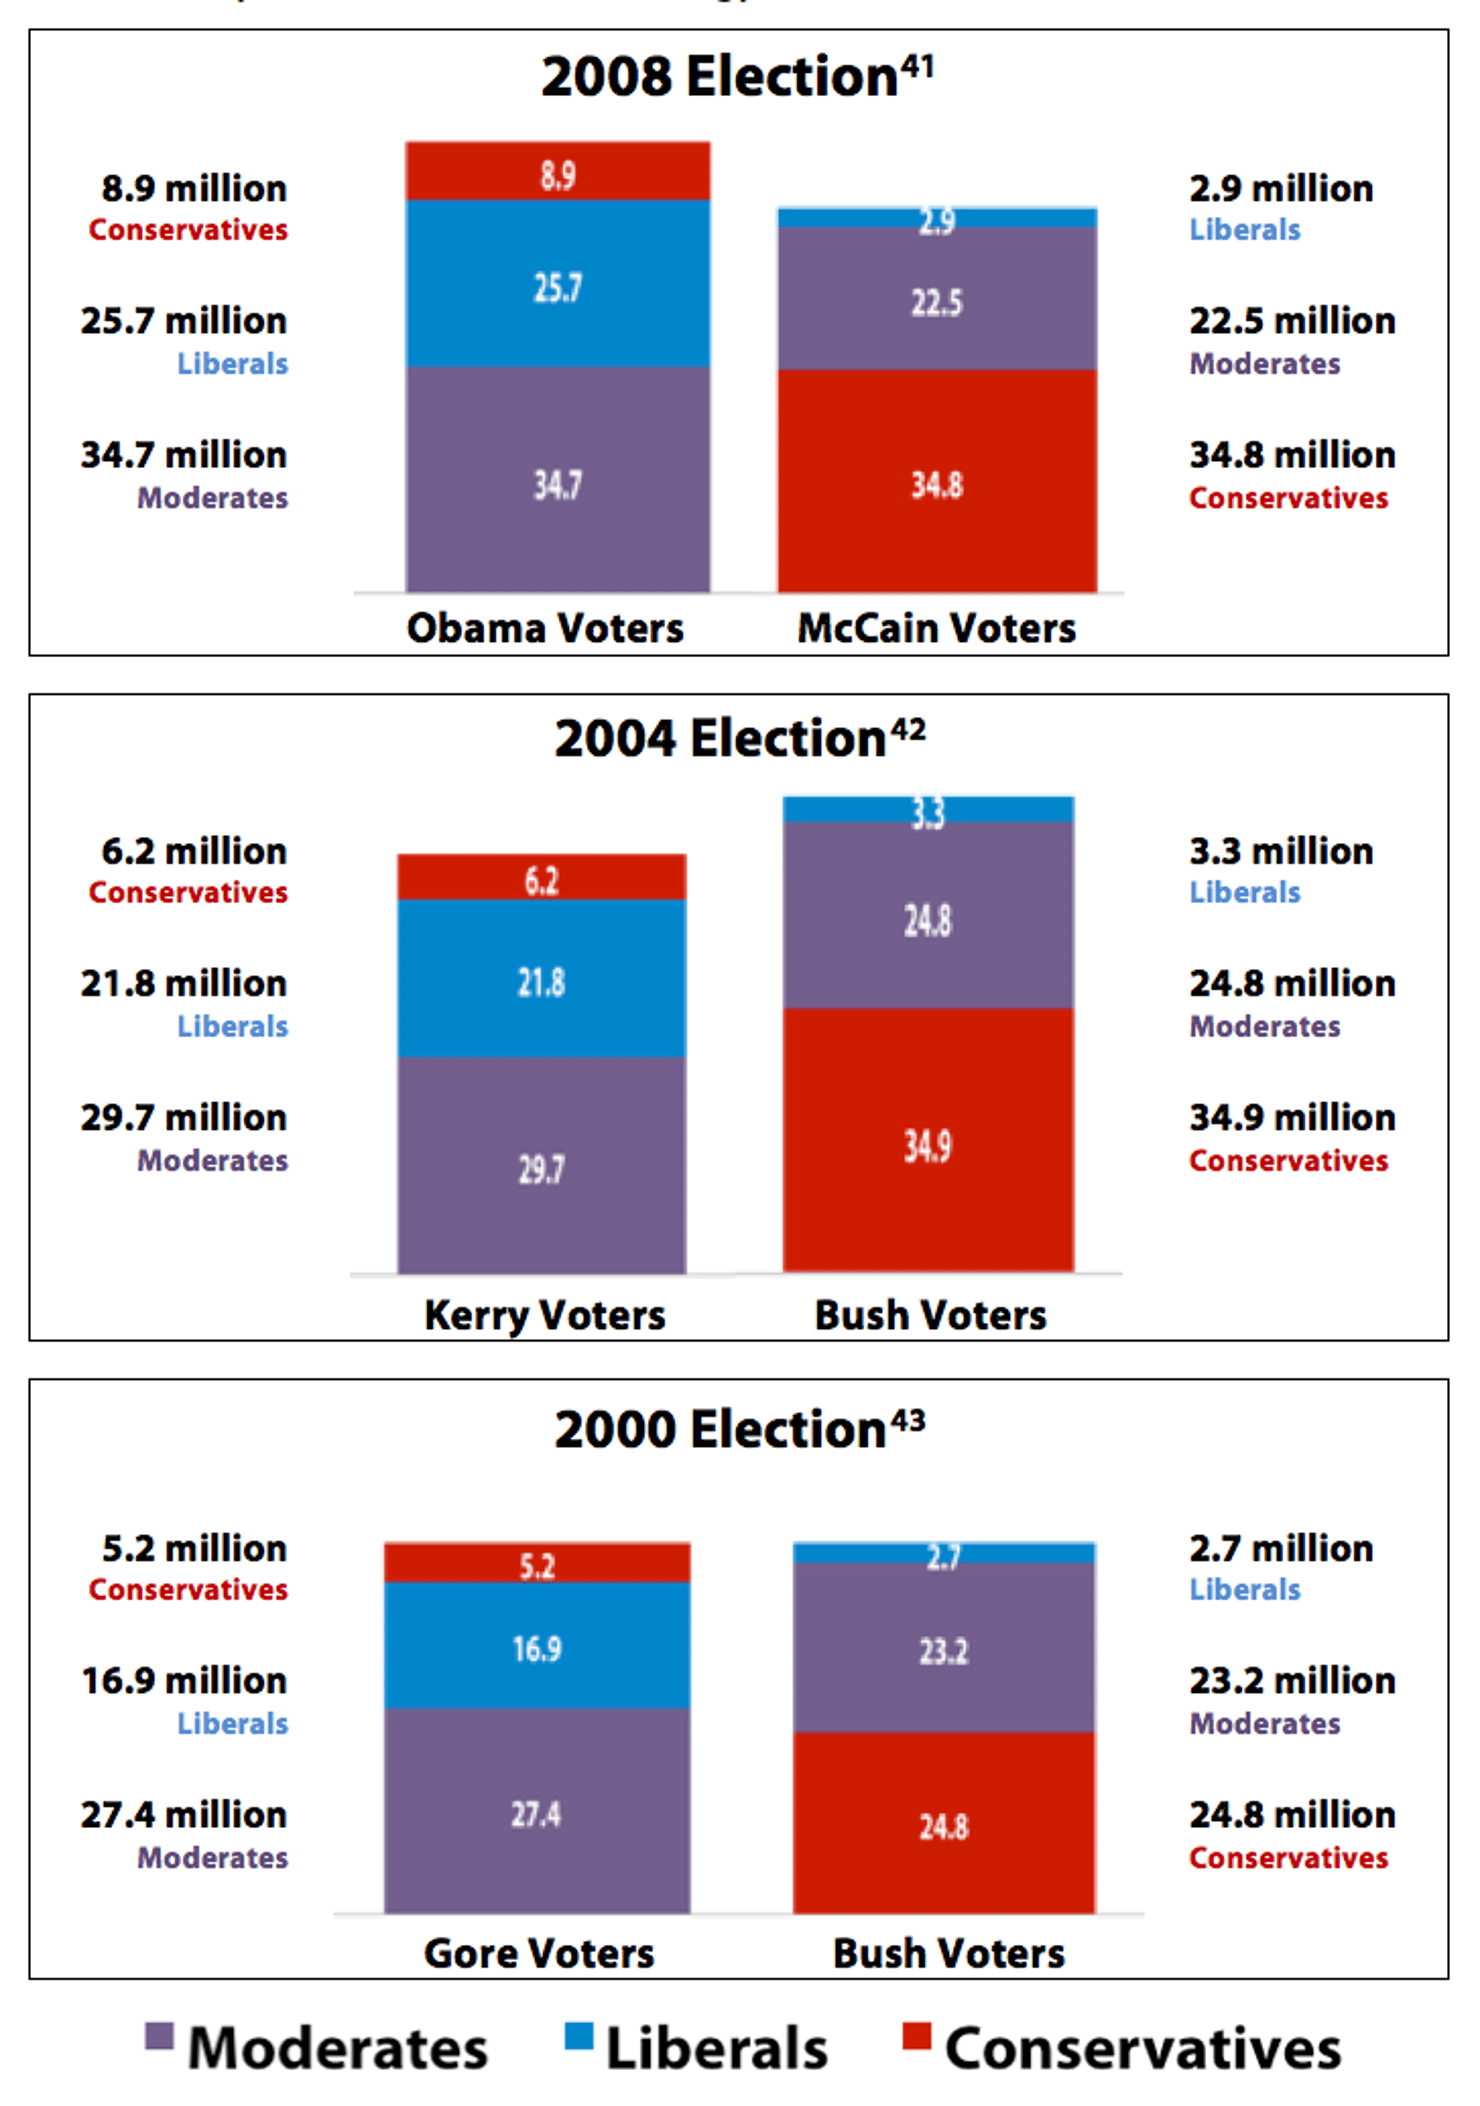
When Democrats win the presidency, their electoral coalition always consists of more moderates than liberals, which holds true as far back as when exit polling began in the 1970s. When Republicans win, conservatives consistently outweigh moderates. The sole exception was Reagan’s 1980 landslide in which moderates slightly outnumbered conservatives.
Moderates had a dramatic impact in critical swing states in 2008. In many of these states, Obama’s share of the moderate vote soared above Kerry’s—by 9 points in Colorado22 and Nevada,23 10 points in Indiana,24 and a stunning 13 points in North Carolina.25 The biggest upsets of 2008 were in Indiana and North Carolina, and they can be largely attributed Obama’s performance among moderates.26 Obama accomplished what both Kerry and Gore failed to do—win over the real base of the Democratic Party—and it landed him in the White House.
Conclusion
Both parties need moderates to win elections. For Republicans, moderates represent the junior partner; for Democrats, they represent the senior partner—at least in terms of votes. Democrats can only win in 2012 and beyond if they are willing to accept this. Not only do moderates tend to lean more Democratic than Independents, they are also a bigger component of the Democratic base than are liberals.
As the presidential race heats up, many pundits and partisans will push Democrats to move left and ignore the interests of moderate voters. But the numbers show that Democrats have not won—and cannot win—by solely appealing to liberals. The number of moderate representatives in Congress may have diminished in the past few elections, but the voice of moderate voters will still be heard loud and clear in races across the country.