Five Ways Program Integrity is Underfunded

Democrats and Republicans are constantly at odds over the size of government. They share a common interest, however, in making sure whatever federal support that does get signed into law actually delivers as intended. That’s where program integrity initiatives come into play—these efforts cut back on waste and fraud and make sure government programs work.
And yet, there’s an imbalance between the growth of program integrity initiatives and the large government programs they’re expected to oversee. In some cases, federal programs grow at two or even three times the rate of the modest program integrity efforts the government currently funds.
As we explained in a previous paper, some program integrity efforts get special treatment in the budget and appropriations process. These program integrity cap adjustments do not count towards the topline discretionary funding limit and, therefore, do not have to compete against other funding priorities in the base discretionary budget.1 The three program integrity accounts in question include health care fraud and abuse control for Medicare and Medicaid, continuing disability reviews and redeterminations for disability programs, and reemployment services and eligibility assessments for Unemployment Insurance. Besides the cap adjustments, other mechanisms such as IRS enforcement funding and inspectors general play a role in program integrity.
In the report below, we provide a snapshot of five core program integrity initiatives and uncover how they are underfunded compared to the programs they are working to help.
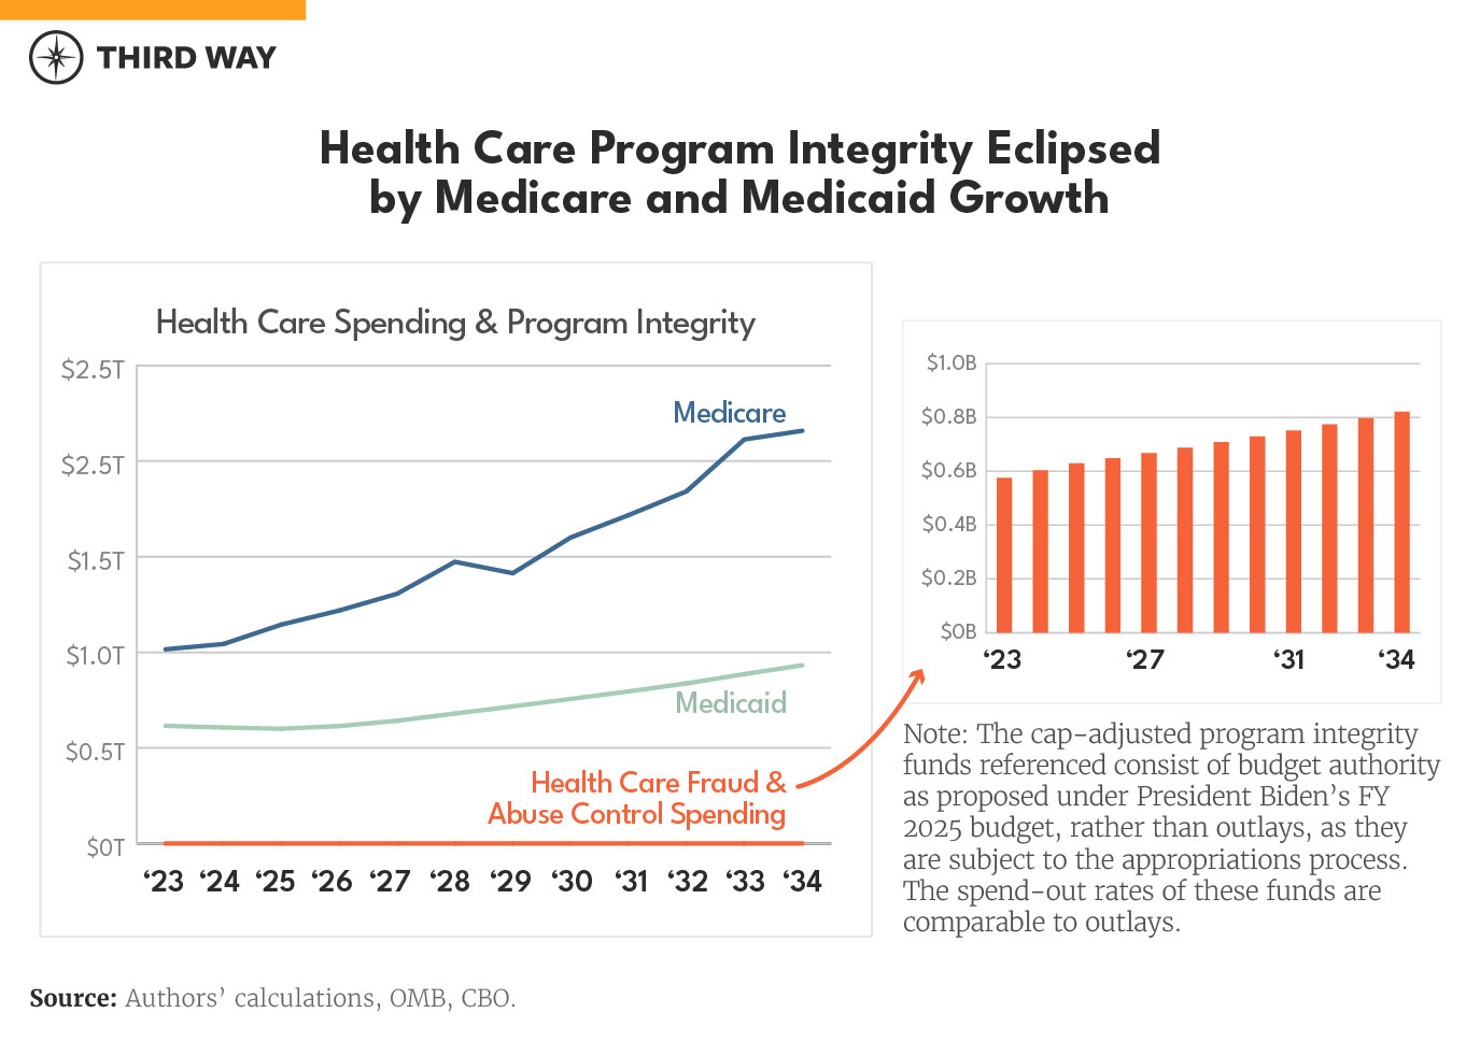
Health Care
Program integrity efforts to combat health care fraud and abuse are projected to grow 4% between 2024 and 2025.2 Medicare, meanwhile, is projected to grow 10% over the next year.3 The contrast is even more striking over 10 years. Efforts targeting health care fraud and abuse were proposed to grow about 30% over the decade under levels recommended in President Biden’s FY 2025 budget, while under current law, Medicare is expected to grow 89% and Medicaid is expected to grow 55%.4
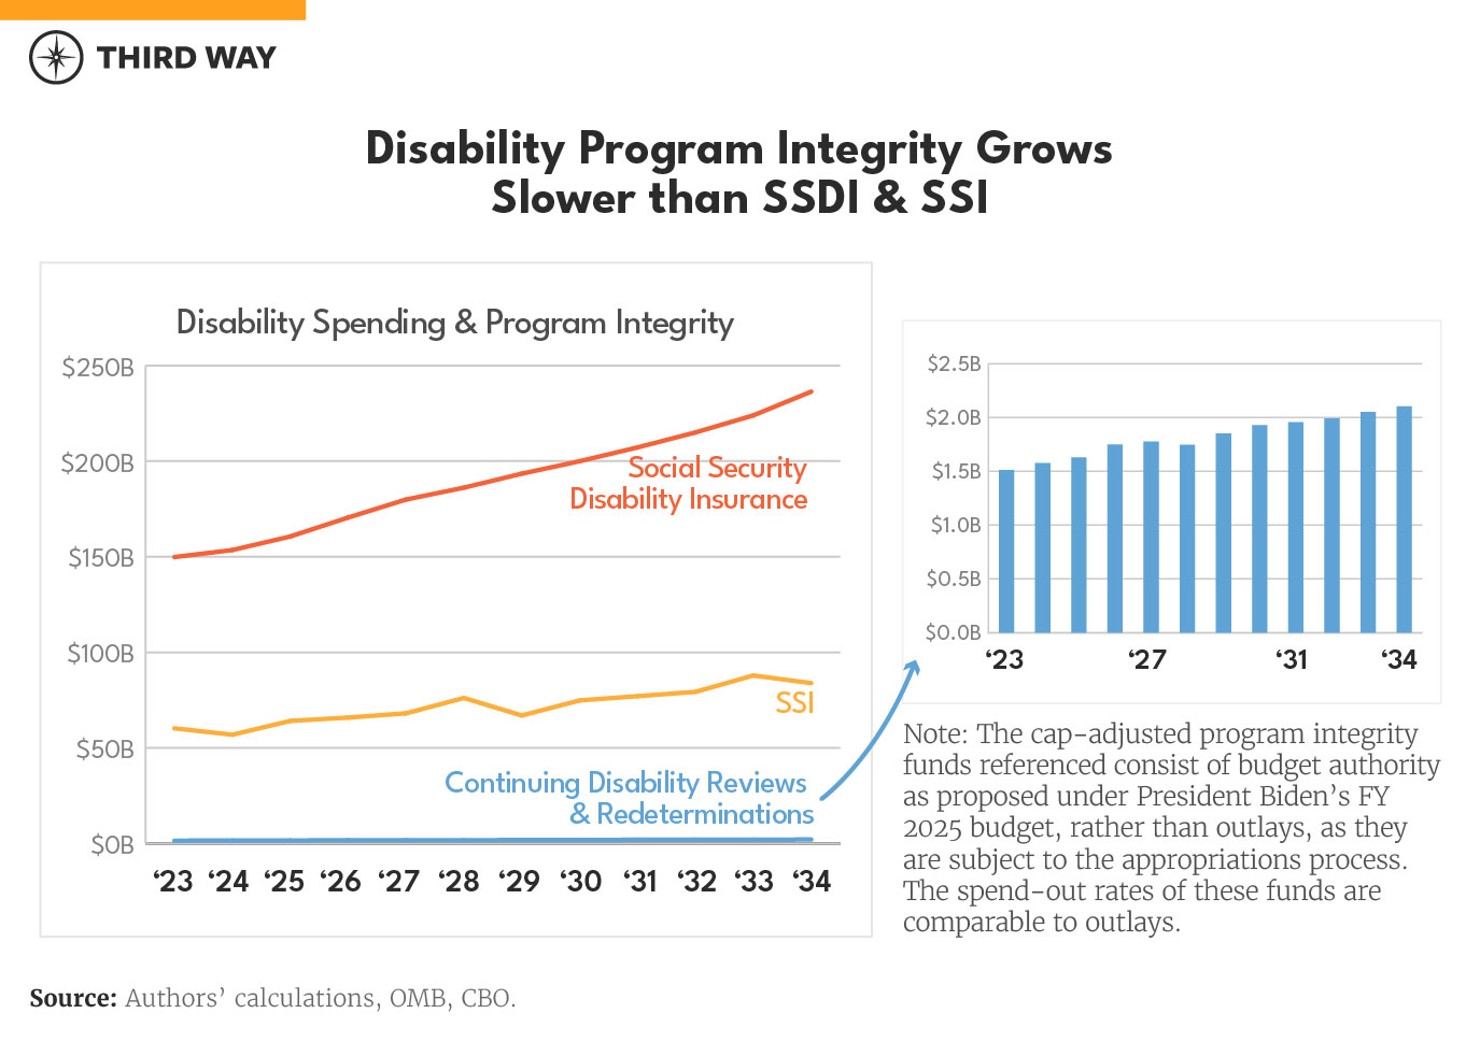
Disability
Program integrity oversight of disability reviews and redeterminations are projected to grow 3% between 2024 and 2025.5 Social Security Disability Insurance (SSDI), meanwhile, is projected to grow 5% over the next year, and Supplemental Security Income (SSI) is projected to grow 13%.6 Over 10 years, program integrity for continuing disability reviews and redeterminations is expected to grow 29% under levels recommended by the Biden Administration, while SSDI is expected to grow 47%.7 SSI growth would be about on par with program integrity growth at 31% over the decade.8
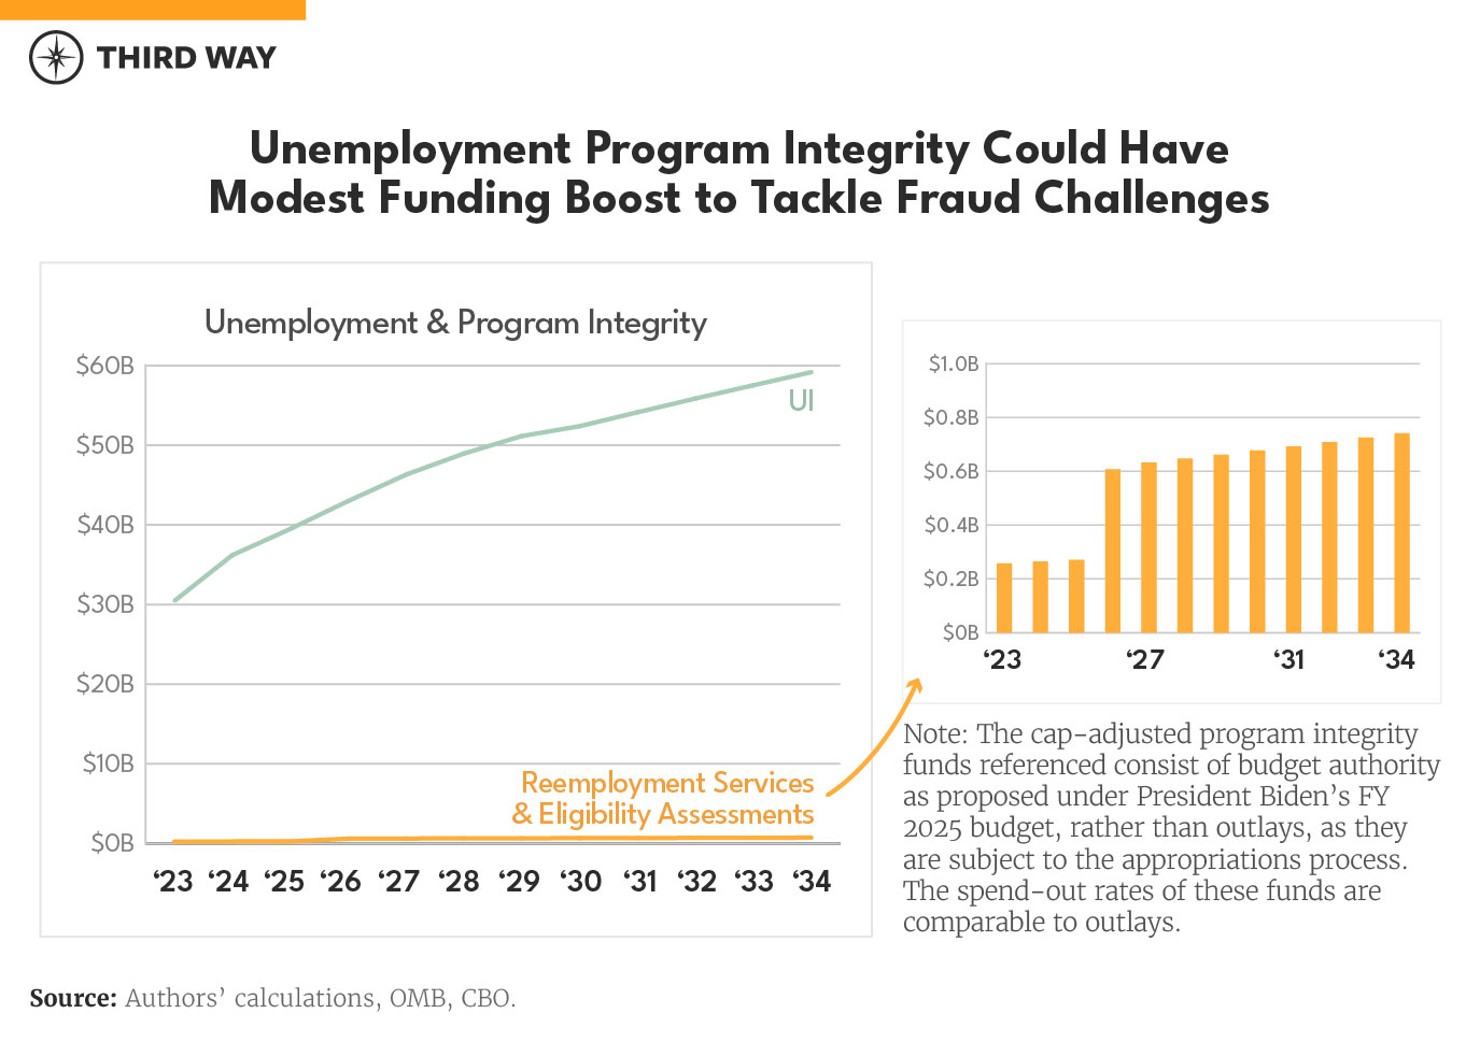
Unemployment
Program integrity efforts for reemployment services and eligibility assessments are projected to grow 2% between 2024 and 2025.9 Unemployment Insurance (UI), meanwhile, is projected to grow 9% over the next year.10 If funding recommendations proposed by the Biden Administration in its FY 2025 budget were to be adopted, the cap adjustment for reemployment services and eligibility assessments would grow 174% over 10 years, while UI is expected to grow 50%, assuming no recessions or related spikes in UI utilization.11 The UI program remains particularly vulnerable to fraud and lost as much as $135 billion during the pandemic, so vastly expanded resources are justifiable.12
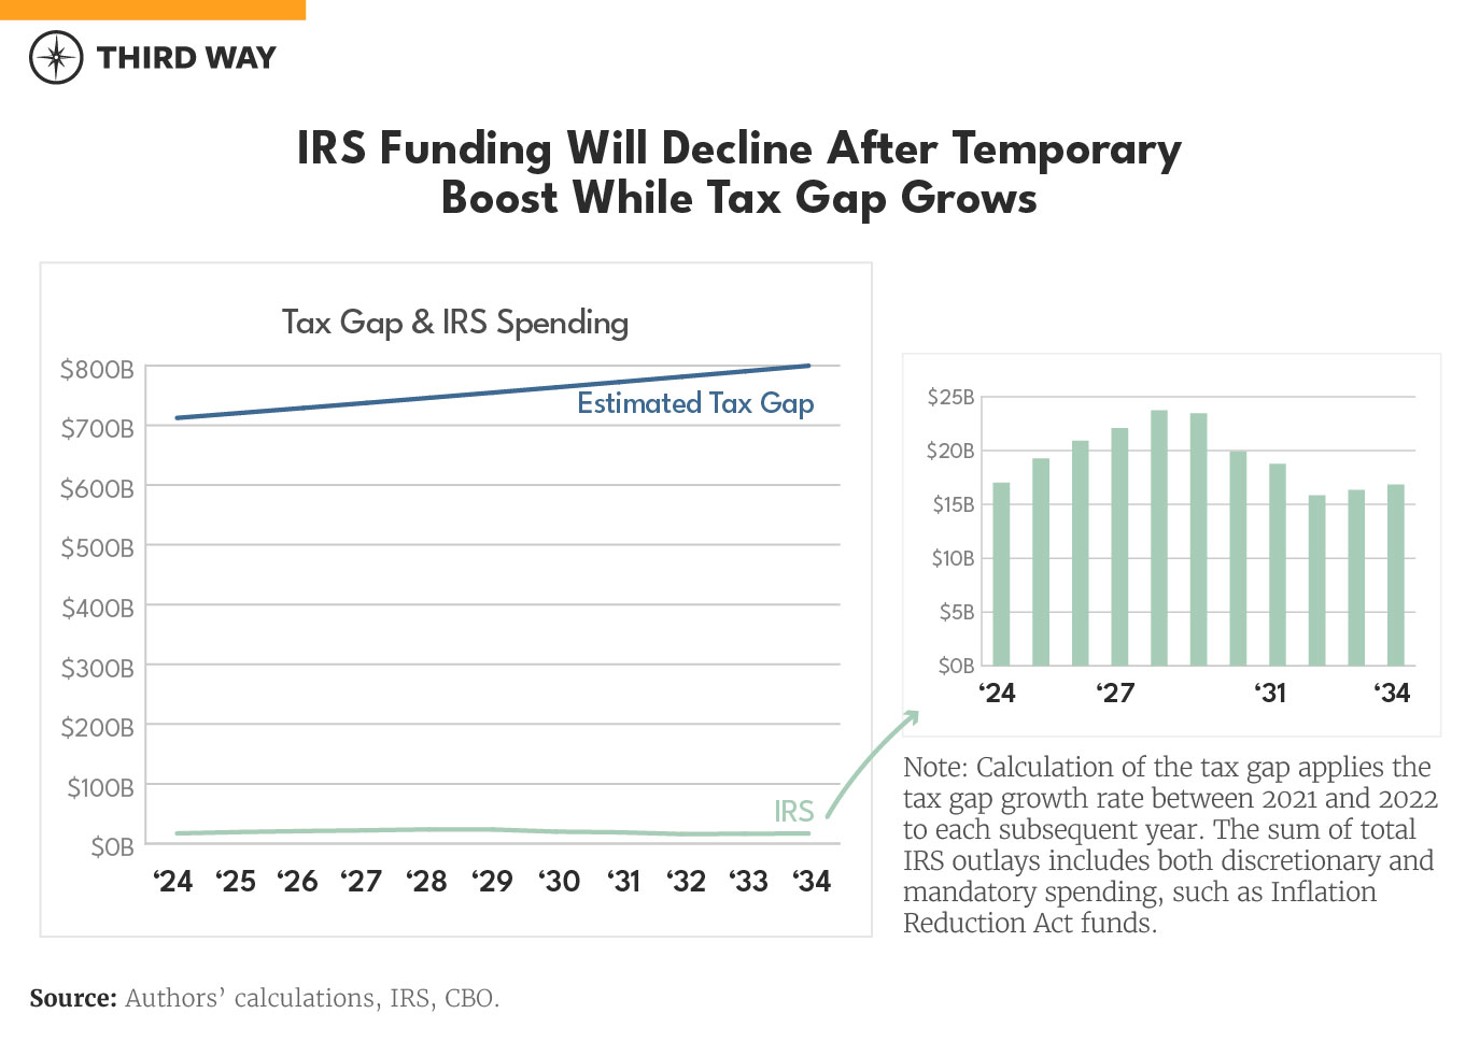
IRS Enforcement
IRS spending has gotten renewed attention as a result of the extra enforcement funds received in the Inflation Reduction Act. This extra IRS funding has been subject to clawbacks in subsequent appropriations laws, however, and remains vulnerable.
The nearly $58 billion from the IRA that the Treasury Department expects to spend through 2031 on extra resources for the IRS is a significant boost to the baseline IRS budget.13 But it pales in comparison to the tax gap over that period that could exceed $7 trillion in total.14 The tax gap—which reflects the difference between what individuals and corporations legally owe and what they pay—grew 1% between 2021 and 2022, according to IRS estimates.15 Extrapolating those trends, the tax gap would grow 11% between now and the end of the decade.16
Between FY 2024 and its all-in peak projected funding in FY 2028, the IRS budget will grow 40%.17 The gross tax gap will grow 5% over that same time frame, based on conservative growth projections.18 But don’t let small percentages fool you—that means the cumulative tax gap will be $3.6 trillion.19 With the expiration of the Inflation Reduction Act funding, over the decade the IRS budget is projected to actually decline 12%—while the tax gap would grow 11%.20
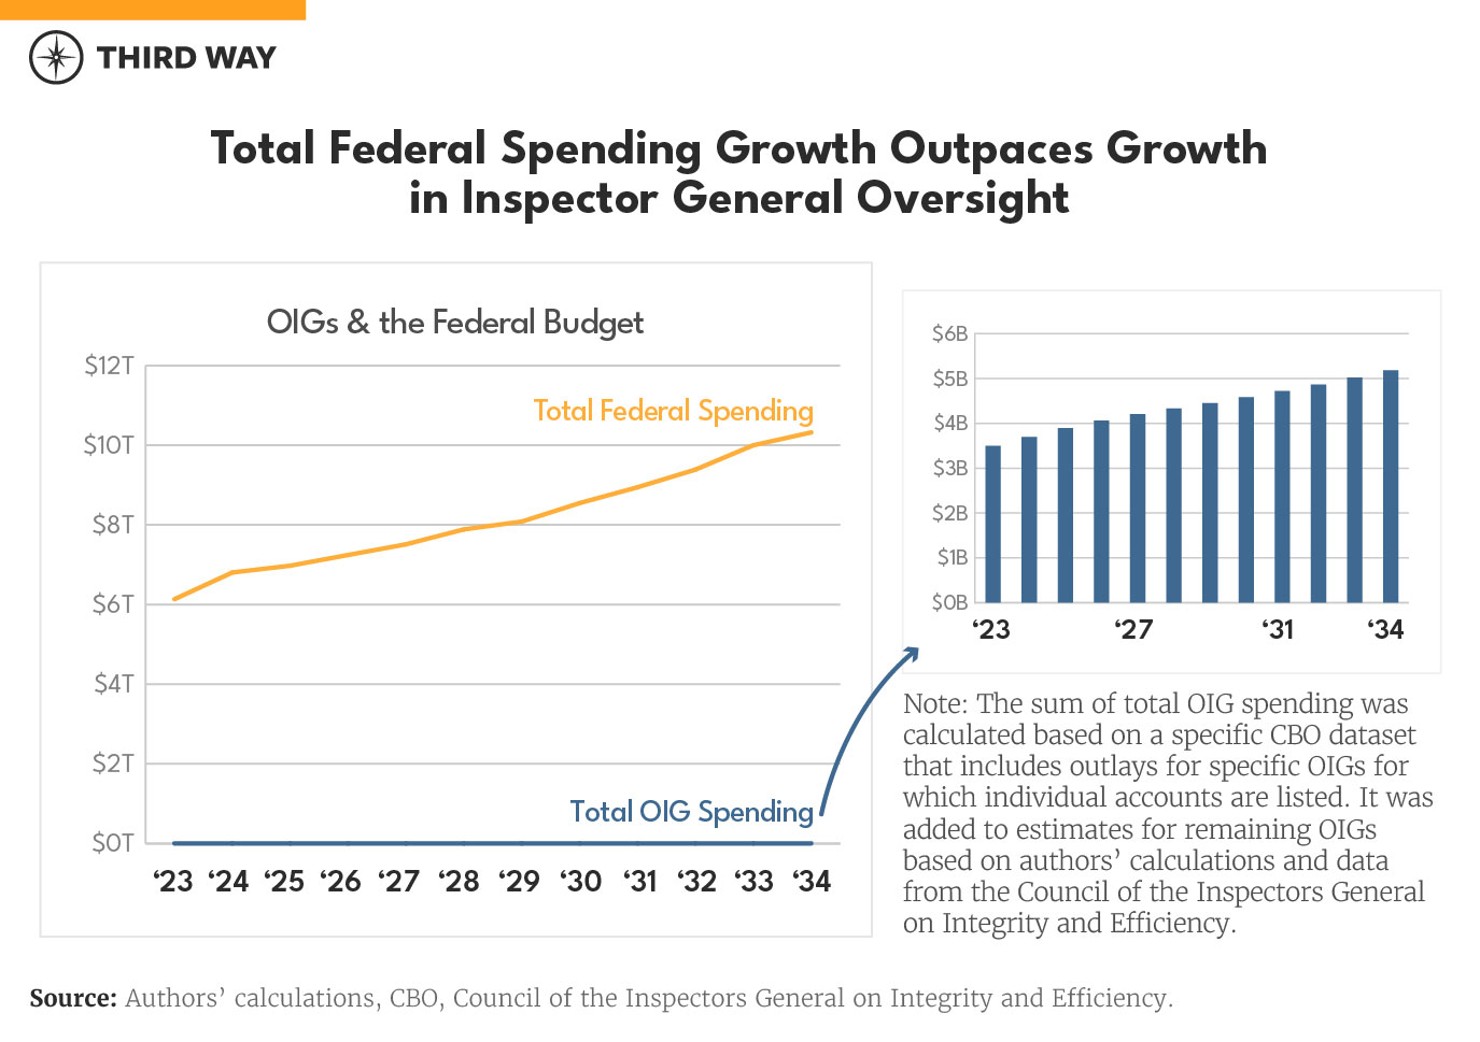
OIGs
Offices of inspectors general receive independent appropriations outside of the agencies they oversee.21 They are typically funded through discretionary spending, however, which constrains their growth and leaves them subject to the uncertainty of the appropriations process.
There are currently 74 offices of inspectors general that received roughly $3.5 billion in FY 2023, mostly through discretionary spending.22 Funding for OIGs is expected to grow 5% between FY 2024 and FY 2025, while total federal spending is expected to grow 2.5%.23 Over the next decade, however, OIGs are expected to grow 33% versus 48% for total federal spending.24

Fraud in COVID-19 pandemic spending produced lessons and recommendations related to treatment of data, expanded authorities of inspector generals, and improved regulations related to improper payments.25 Take, for example, the Small Business Administration which has been credited with making improvements to its anti-fraud efforts, including through the creation of a Fraud Risk Management Board. And yet, it remains on the Government Accountability Office’s high-risk list.26
In terms of budgetary resources, most of the Small Business Administration’s program integrity efforts stem from the Small Business Administration’s Office of Inspector General. The trajectory of SBA inspector general funding is similar to other OIGs in the federal government—it’s tied to discretionary spending and is expected to grow about 22% by the end of the decade.27
Conclusion
Program integrity funding is slated to grow at a slower rate than the programs it is expected to protect against fraud and abuse. Notably, two aspects of the budget process itself create a bias against program integrity spending: scorekeeping rules and tight limitations on discretionary spending.
Currently, the Congressional Budget Office can provide estimates for savings from program integrity spending separately from the topline cost or savings number, categorizing it as “nonscoreable” spending reductions or revenue increases. The actual spending on administrative resources that make up program integrity initiatives, meanwhile, is included in the topline cost.
This scorekeeping norm creates incentives for lawmakers to keep program integrity spending out of big legislation because it appears to add to the cost of the bill—even when savings from reduced fraud and waste are greater than the cost associated with targeting fraud and waste. Two main scoring guidelines under current rules affect program integrity, and CBO, OMB, and the Budget Committees should revisit them in future scorekeeping meetings.28
The second bias against program integrity, its tethering to the annual appropriations process, is harder to overcome. Discretionary spending that is subject to congressional power of the purse isn’t inherently bad, but it’s often unpredictable and increasingly squeezed out by other priorities. As the national debt increases, nondefense discretionary spending, in particular, tends to make up a smaller share of the federal budget and shrinks as a pool of resources that program integrity efforts can draw from.29
If lawmakers are serious about real program integrity in the federal government, they need to at least make sure it’s prioritized in each piece of appropriations legislation that Congress passes. As a longer-term goal, they should revisit some of the structural barriers in the budget to unleash its full potential.
Endnotes
Moller, Zach and Shuppy, Annie. “Program Integrity Discretionary Cap Adjustments Explained.” Third Way, 24 October 2024. https://www.thirdway.org/memo/program-integrity-discretionary-cap-adjustments-explained. Accessed 5 December 2024.
Authors’ calculations based on Office of Management and Budget. “Analytical Perspectives, Budget of the U.S. Government Fiscal Year 2025.” Office of Management and Budget, 11 March 2024, https://www.whitehouse.gov/wp-content/uploads/2024/03/spec_fy2025.pdf. Accessed 5 December 2024.
The cap-adjusted program integrity funds referenced consist of budget authority rather than outlays, as they are subject to the appropriations process. The spend-out rates of these funds are comparable to outlays.
Authors’ calculations based on Congressional Budget Office. “An Update to the Budget and Economic Outlook: 2024 to 2034.” Congressional Budget Office, 18 Jun. 2024, https://www.cbo.gov/publication/60039. Accessed 5 December 2024.
Authors’ calculations based on Office of Management and Budget. “Analytical Perspectives, Budget of the U.S. Government Fiscal Year 2025.” Office of Management and Budget, 11 March 2024, https://www.whitehouse.gov/wp-content/uploads/2024/03/spec_fy2025.pdf. Accessed 5 December 2024. And; Congressional Budget Office. “An Update to the Budget and Economic Outlook: 2024 to 2034.” Congressional Budget Office, 18 Jun. 2024, https://www.cbo.gov/publication/60039. Accessed 5 December 2024.
The $604 million in cap-adjusted funds for health care fraud and abuse control in FY 2024 were supplemented by $311 million in base discretionary spending and $1.575 billion in mandatory spending, for a total of $2.522 billion. Even when these additional funds are included, however, this program integrity category would only grow 3% over the next year and 31% over the next decade—not keeping pace with the programs these oversight resources are expected to cover.
These projections are based on OMB Analytical Perspectives and discretionary spending growth numbers based on CBO June 2024 Budget Outlook.
Authors’ calculations based on Office of Management and Budget. “Analytical Perspectives, Budget of the U.S. Government Fiscal Year 2025.” Office of Management and Budget, 11 March 2024, https://www.whitehouse.gov/wp-content/uploads/2024/03/spec_fy2025.pdf. Accessed 5 December 2024.
The cap-adjusted program integrity funds referenced consist of budget authority rather than outlays, as they are subject to the appropriations process. The spend-out rates of these funds are comparable to outlays.
Authors’ calculations based on Congressional Budget Office. “An Update to the Budget and Economic Outlook: 2024 to 2034.” Congressional Budget Office, 18 Jun. 2024, https://www.cbo.gov/publication/60039. Accessed 5 December 2024.
The calculation of SSI growth is based on mandatory spending unadjusted for timing shifts. When adjusted for timing shifts, SSI spending would grow 4% between 2024 and 2025.
Authors’ calculations based on Office of Management and Budget. “Analytical Perspectives, Budget of the U.S. Government Fiscal Year 2025.” Office of Management and Budget, 11 March 2024, https://www.whitehouse.gov/wp-content/uploads/2024/03/spec_fy2025.pdf. Accessed 5 December 2024. And; Congressional Budget Office. “An Update to the Budget and Economic Outlook: 2024 to 2034.” Congressional Budget Office, 18 Jun. 2024, https://www.cbo.gov/publication/60039. Accessed 5 December 2024.
Like health care program integrity, disability program integrity also receives some base discretionary funds in addition to the cap adjustment. For FY 2024, continuing disability reviews and redeterminations received $1.578 billion in cap-adjusted funds and $273 million in base discretionary funding, for a total of $1.851 billion. When these broader program integrity funds are included, these resources would only grow 3% over the next year and 28% over the decade.
These projections are based on OMB Analytical Perspectives and discretionary spending growth numbers based on CBO June 2024 Budget Outlook.
Authors’ calculations based on Congressional Budget Office. “An Update to the Budget and Economic Outlook: 2024 to 2034.” Congressional Budget Office, 18 Jun. 2024, https://www.cbo.gov/publication/60039. Accessed 5 December 2024.
The calculation of SSI growth is based on mandatory spending unadjusted for timing shifts. When adjusted for timing shifts, SSI spending would grow 30% over the decade.
Authors’ calculations based on Office of Management and Budget. “Analytical Perspectives, Budget of the U.S. Government Fiscal Year 2025.” Office of Management and Budget, 11 March 2024, https://www.whitehouse.gov/wp-content/uploads/2024/03/spec_fy2025.pdf. Accessed 5 December 2024.
The cap-adjusted program integrity funds referenced consist of budget authority rather than outlays, as they are subject to the appropriations process. The spend-out rates of these funds are comparable to outlays.
Authors’ calculations based on Congressional Budget Office. “An Update to the Budget and Economic Outlook: 2024 to 2034.” Congressional Budget Office, 18 Jun. 2024, https://www.cbo.gov/publication/60039. Accessed 5 December 2024.
- uthors’ calculations based on Office of Management and Budget. “Analytical Perspectives, Budget of the U.S. Government Fiscal Year 2025.” Office of Management and Budget, 11 March 2024, https://www.whitehouse.gov/wp-content/uploads/2024/03/spec_fy2025.pdf. Accessed 5 December 2024. And; Congressional Budget Office. “An Update to the Budget and Economic Outlook: 2024 to 2034.” Congressional Budget Office, 18 Jun. 2024, https://www.cbo.gov/publication/60039. Accessed 5 December 2024.
OMB assumes that in 2026 these funds revert to the levels authorized during the Trump administration in the Bipartisan Budget Act of 2018.
Like the other two program integrity categories, unemployment program integrity also receives some base discretionary funds in addition to the cap adjustment. For FY 2024, reemployment services and eligibility assessments received $265 million in cap-adjusted funds and $117 million in base discretionary funding, for a total of $382 million. When these broader program integrity funds are included, these resources would only grow 2% over the next year and 128% over the decade.
These projections are based on OMB Analytical Perspectives and discretionary spending growth numbers based on CBO June 2024 Budget Outlook.
Hernandez, Fredrick, Moller, Zach and Shuppy, Annie. “Program Integrity: Making Unemployment Insurance Work Better.” Third Way, 27 September 2024. https://www.thirdway.org/memo/program-integrity-making-unemployment-insurance-work-better. Accessed 5 December 2024.
Treasury Inspector General for Tax Administration. “Quarterly Snapshot: The IRS’s Inflation Reduction Act Spending Through June 30, 2024.” Treasury Inspector General for Tax Administration, 30 September 2024. https://www.tigta.gov/sites/default/files/reports/2024-10/2024ier020fr.pdf. Accessed 5 December 2024.
Authors’ calculations based on Internal Revenue Service Research, Applied Analytics and Statistics. “Federal Tax Compliance Research: Tax Gap Projections for Tax Years 2020 and 2021.” Internal Revenue Service, October 2023. https://www.irs.gov/pub/irs-prior/p5869--2023.pdf. Accessed 5 December 2024. And; Internal Revenue Service Research, Applied Analytics and Statistics. “Tax Gap Projections for Tax Year 2022.” Internal Revenue Service, October 2024. https://www.irs.gov/pub/irs-pdf/p5869.pdf. Accessed 5 December 2024.
Calculation of the cumulative tax gap between 2022 and 2031 applies the tax gap growth rate between 2021 and 2022 to each subsequent year. This growth rate reflects the data for the latest available years; actual growth rates in the tax gap could change based on additional resources for IRS enforcement and other factors.
Internal Revenue Service Research, Applied Analytics and Statistics. “Federal Tax Compliance Research: Tax Gap Projections for Tax Years 2020 and 2021.” Internal Revenue Service, October 2023. https://www.irs.gov/pub/irs-prior/p5869--2023.pdf. Accessed 5 December 2024. And; Internal Revenue Service Research, Applied Analytics and Statistics. “Tax Gap Projections for Tax Year 2022.” Internal Revenue Service, October 2024. https://www.irs.gov/pub/irs-pdf/p5869.pdf. Accessed 5 December 2024.
Authors’ calculations based on Internal Revenue Service Research, Applied Analytics and Statistics. “Federal Tax Compliance Research: Tax Gap Projections for Tax Years 2020 and 2021.” Internal Revenue Service, October 2023. https://www.irs.gov/pub/irs-prior/p5869--2023.pdf. Accessed 5 December 2024. And; Internal Revenue Service Research, Applied Analytics and Statistics. “Tax Gap Projections for Tax Year 2022.” Internal Revenue Service, October 2024. https://www.irs.gov/pub/irs-pdf/p5869.pdf. Accessed 5 December 2024.
Calculation of the growth in the tax gap between 2025 and 2034 is determined by applying the tax gap growth rate between 2021 and 2022 to each subsequent year and then calculating the rate of change between 2025 and 2034 from those totals. The growth rate used to calculate the year-to-year tax gap data over the next decade reflects the data for the latest available years; actual growth rates in the tax gap could change based on additional resources for IRS enforcement and other factors.
In addition, the tax gap could be even higher if estimated based on a fixed percent of GDP. If the 2.8% of GDP gross tax gap from 2022 is extrapolated, the gross tax over the next decade would grow 39%, rather than 11%. It would total $8.7 trillion through 2031, rather than $7.3 trillion. One might argue that enhanced IRS enforcement may limit this growth, but it remains to be seen how lasting the effects might be, especially with further rescissions.
Authors’ calculations based on Congressional Budget Office. “An Update to the Budget and Economic Outlook: 2024 to 2034.” Congressional Budget Office, 18 Jun. 2024, https://www.cbo.gov/publication/60039. Accessed 5 December 2024.
The sum of total IRS outlays for each year over the next decade was calculated based on a specific CBO dataset within the June 2024 budget outlook: Spending Projections, by Budget Account. It includes both regular appropriations for the IRS that are classified as discretionary spending and Inflation Reduction Act-provided resources classified as mandatory spending.
Authors’ calculations based on Internal Revenue Service Research, Applied Analytics and Statistics. “Federal Tax Compliance Research: Tax Gap Projections for Tax Years 2020 and 2021.” Internal Revenue Service, October 2023. https://www.irs.gov/pub/irs-prior/p5869--2023.pdf. Accessed 5 December 2024. And; Internal Revenue Service Research, Applied Analytics and Statistics. “Tax Gap Projections for Tax Year 2022.” Internal Revenue Service, October 2024. https://www.irs.gov/pub/irs-pdf/p5869.pdf. Accessed 5 December 2024.
Calculation of the growth in the tax gap between 2024 and 2028 applies the tax gap growth rate between 2021 and 2022 to each subsequent year. The growth rate used to calculate the year-to-year tax gap data over the next decade reflects the data for the latest available years; actual growth rates in the tax gap could change based on additional resources for IRS enforcement and other factors.
Authors’ calculations based on Internal Revenue Service Research, Applied Analytics and Statistics. “Federal Tax Compliance Research: Tax Gap Projections for Tax Years 2020 and 2021.” Internal Revenue Service, October 2023. https://www.irs.gov/pub/irs-prior/p5869--2023.pdf. Accessed 5 December 2024. And; Internal Revenue Service Research, Applied Analytics and Statistics. “Tax Gap Projections for Tax Year 2022.” Internal Revenue Service, October 2024. https://www.irs.gov/pub/irs-pdf/p5869.pdf. Accessed 5 December 2024.
Calculation of the cumulative tax gap between 2024 and 2028 applies the tax gap growth rate between 2021 and 2022 to each subsequent year. This growth rate reflects the data for the latest available years; actual growth rates in the tax gap could change based on additional resources for IRS enforcement and other factors.
Authors’ calculations based on Congressional Budget Office. “An Update to the Budget and Economic Outlook: 2024 to 2034.” Congressional Budget Office, 18 Jun. 2024, https://www.cbo.gov/publication/60039. Accessed 5 December 2024.
The sum of total IRS outlays for each year over the next decade was calculated based on a specific CBO dataset within the June 2024 budget outlook: Spending Projections, by Budget Account. It includes both regular appropriations for the IRS that are classified as discretionary spending and Inflation Reduction Act-provided resources classified as mandatory spending.
Wilhelm, Ben. “Statutory Inspectors General in the Federal Government: A Primer.” Congressional Research Service, 13 November 2023, https://crsreports.congress.gov/product/pdf/r/r45450. Accessed 5 December 2024.
Council of the Inspectors General on Integrity and Efficiency. “Council of the Inspectors General on Integrity and Efficiency Annual Report to the President and Congress Fiscal Year 2023.” Council of the Inspectors General on Integrity and Efficiency, 19 March 2024, https://www.ignet.gov/sites/default/files/files/CIGIEAnnualReporttothePresidentFY2023_FINAL.pdf. Accessed 5 December 2024.
Authors’ calculations based on Congressional Budget Office. “An Update to the Budget and Economic Outlook: 2024 to 2034.” Congressional Budget Office, 18 Jun. 2024, https://www.cbo.gov/publication/60039. Accessed 5 December 2024.
The sum of total OIG spending for each year over the next decade and its growth rates was calculated based on a specific CBO dataset within the June 2024 budget outlook: Spending Projections, by Budget Account. It includes outlays both for specific OIGs for which individual accounts are listed and for estimates for remaining OIGs.
Pandemic Response Accountability Committee. “Blueprint for Enhanced Program Integrity.” Pandemic Response Accountability Committee, August 2024, https://www.pandemicoversight.gov/media/file/blueprint-chapter-2. Accessed 5 December 2024.
Government Accountability Office. “High Risk Series: Efforts Made to Achieve Progress Need to Be Maintained and Expanded in Fully Address All Areas.” Government Accountability Office, 20 April 2023, https://files.gao.gov/reports/GAO-23-106203/index.html. Accessed 5 December 2024.
Authors’ calculations based on Congressional Budget Office. “An Update to the Budget and Economic Outlook: 2024 to 2034.” Congressional Budget Office, 18 Jun. 2024, https://www.cbo.gov/publication/60039. Accessed 5 December 2024.
Hall, Keith. “Beyond Dynamic Scoring: Enhancing CBO’s Evaluation of Program Integrity Spending.” Mercatus Center, 11 June 2024, https://www.mercatus.org/research/research-papers/beyond-dynamic-scoring-enhancing-cbos-evaluation-program-integrity. Accessed 4 December 2024.
Colavito, Anthony, Horwitz, Gabe, Moller, Zach and Shuppy, Annie. “A Democratic Case for Fiscal Responsibility.” Third Way, 5 February 2024. https://www.thirdway.org/report/a-democratic-case-for-fiscal-responsibility. Accessed 4 December 2024.
Subscribe
Get updates whenever new content is added. We'll never share your email with anyone.