Shutting Down U.S. Nuclear Plants is Still Bad News for Environmentalists

It is increasingly likely that the United States could see a significant percentage of its nuclear power plants close, thanks to low natural gas prices and ongoing subsidies for renewable energy. For anti-nuclear activists, this news may seem rosy. But if you care about climate change this is very bad news.
On February 5 it was reported that, due to the economic challenges facing nuclear energy, the Department of Energy was reviewing a scenario where fully a third of the country’s nuclear power reactors shut down.1 That would be a total loss of nearly three dozen plants. Many casual observers, harkening back to the 1970s protests against nuclear weapons and energy, would think that this is good news for environmentalists. But in the age of climate change, it is not. In fact, as recent experience in Germany has shown, closing nuclear plants has brought huge jumps in carbon pollution. Analysis by Third Way finds that the US could suffer a similar increase in emissions if more nuclear plants start closing their doors here.
Shutting down a third of the US nuclear fleet would raise electric sector carbon dioxide emissions 8.0%.2 To calculate this, Third Way ran a scenario replacing a third of the U.S. nuclear fleet# with the average U.S. non-nuclear power generation mix (coal, natural gas, renewables). This would raise emissions by 167 million metric tons CO2. That’s the equivalent of adding a state with the combined emissions of Florida and Oklahoma3—hardly an insignificant amount. In relative terms, this 8-point leap is twice the single-year effect that Germany experienced when it shuttered 40% of its nuclear plants in 2011.
Closing Nuclear Plants Would Halve Seven Years of Progress4
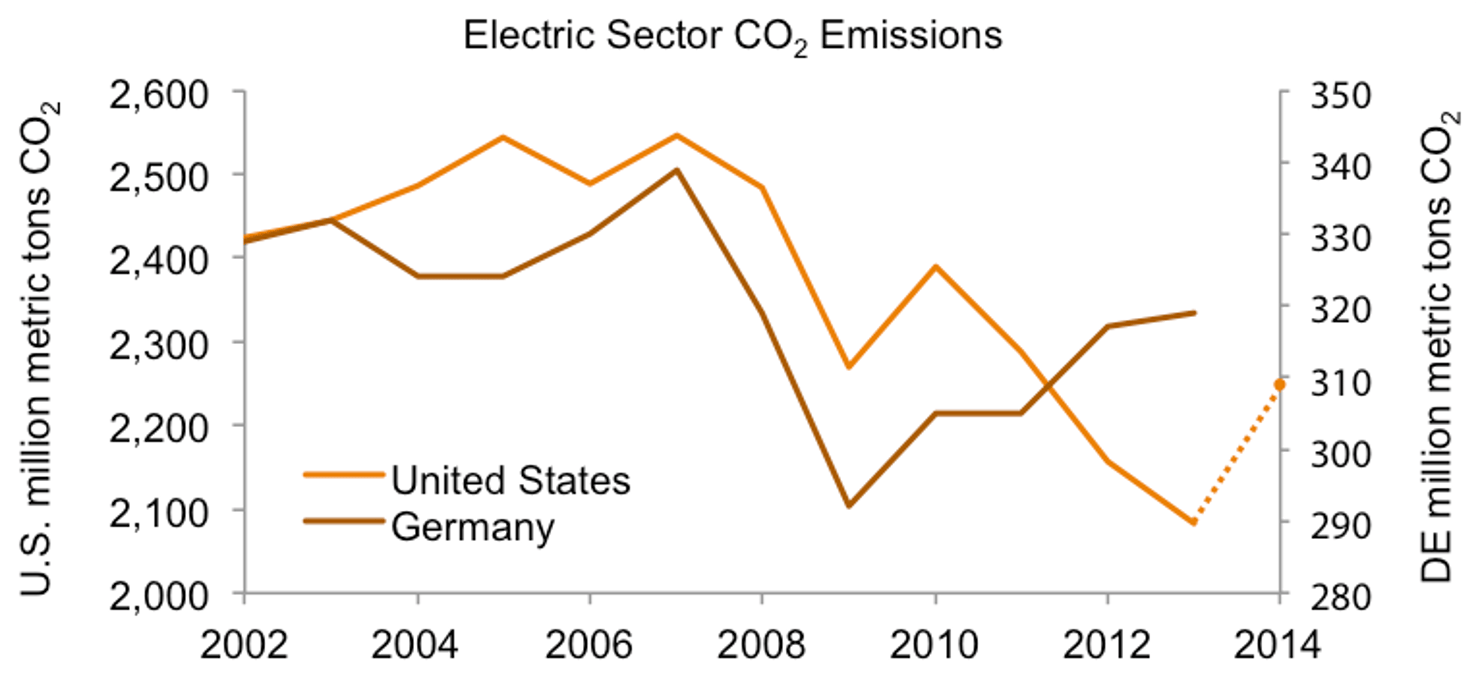
The extremely likely increase in emissions that would follow the closing of American nuclear plants would mark a tragic reversal of the success we’ve had in cutting carbon pollution in recent years. From 2007 to 2013, the United States reduced carbon emissions in the electricity sector by 18%.5 In 2007, Germany was on the same path: both countries’ carbon emissions started falling. Their paths diverged after the earthquake, tsunami, and nuclear accident at Fukushima in 2011. While the U.S. evaluated its nuclear safety and decided, with some adjustments, to stay the course, Germany immediately shut down 40% of its nuclear power generation.6 German electric sector emissions jumped 4% from 2011 to 2012. U.S. emissions kept declining.
Three years after Fukushima, the world still faces the enormous challenge of reducing greenhouse gas emissions. By moving to eliminate nuclear energy, Germany has presented a lesson in how not to go about it. Besides raising emissions, the move has increased German dependency on natural gas—hardly a desirable position given ongoing tensions in Ukraine.7 The U.S. economy may be more insulated, but letting a significant percentage of our nuclear plants shut down would have dire consequences. Third Way’s analysis of the resulting emissions impact should serve as a warning to environmentalists—and especially to climate hawks—that letting a number of our nuclear plants close is a path we should not take.
Endnotes
Hannah Northey, “Spate of reactor closures threatens U.S. climate goals -- DOE,â€Â Energy and Environment News, Subscription, February 5, 2014. Accessed February 7, 2014. Available at: http://www.eenews.net/greenwire/stories/1059994082.
Â
The U.S. generated 3.7 million Gwh electricity from December 2012 to November 2013, inclusive. Nuclear accounted for 0.7 million Gwh (19%). Meanwhile, the U.S. electric sector generated 2.1 billion metric tons CO2 in 2013. As nuclear generates no CO2 emissions, the non-nuclear fleet thus generated 0.69 metrics tons CO2 per Mwh. Meanwhile, 1.2 million Gwh electricity from natural gas and 0.44 billion metric tons CO2 emissions from electricity from natural gas indicates the natural gas fleet generated 0.43 metric tons CO2 per Mwh. See United States, Department of Energy, Energy Information Administration, “Table 1.1 Net Generation by Energy source: Total (All Sectors), 2003-November 2013,â€Â Electric Power Monthly, January 23, 2014. Accessed February 7, 2014. Available at: http://www.eia.gov/electricity/monthly/epm_table_grapher.cfm?t=epmt_1_1; See also United States, Department of Energy, Energy Information Administration, “Energy-Related Carbon Dioxide Emissions by Sector and Source, United States,†Annual Energy Outlook 2014 Early Release, interactive database. Accessed February 7, 2014. Available at: http://www.eia.gov/oiaf/aeo/tablebrowser/ - release=AEO2014ER&subject=4-AEO2014ER&table=17-AEO2014ER®ion=1-0&cases=full2013-d102312a,ref2014er-d102413a.
Â
In 2010, Oklahoma’s electric power emissions were 47 million metric tons CO2 and Florida’s 118. See “CAIT 2.0 beta,†World Resources Institute, interactive database. Accessed February 7, 2014. Available at: http://cait2.wri.org/wri.
Â
For 2002 - 2012 data, See United States, Department of Energy, Energy Information Administration, “Table 9.1 Emissions from Energy Consumption,†Table, Accessed February 7, 2014. Available at: www.eia.gov/electricity/annual/html/epa_09_01.html; For 2013 estimate, See United States, Department of Energy, Energy Information Administration, “Total Energy Supply, Disposition, and Price Summary, Reference Case,†Annual Energy Outlook 2014 Early Release, Interactive Table, Accessed February 7, 2014. Available at: www.eia.gov/oiaf/aeo/tablebrowser/#release=AEO2014ER; For 2014 projections are author calculations; For Germany’s 2002-2012 data, See Germany, Umwelt Bundesamt (German Environmental Protection Agency), Petra Icha, â€Entwicklung der spezifischen Kohlendioxid-Emissionen des deutschen Strommix in den Jahren 1990 bis 2012,†Report, p. 2, Accessed March 5, 2014. Available at: www.umweltbundesamt.de/sites/default/files/medien/461/publikationen/climate_change_07_2013_icha_co2emissionen_des_dt_strommixes_webfassung_barrierefrei.pdf; For Germany’s 2013 estimate, See Agora Energiewende, “Die Energiewende im Stromsektor 2013: Erzeugung, Verbrauch, Erneuerbare Energien und CO2-Emissionen,†Presentation, slide 10, Accessed March 5, 2014. Available at: http://www.agora-energiewende.de/fileadmin/downloads/publikationen/Faktencheck/2013er_Zahlen/Energiewende_im_Stromsektor_2013_Variante1.pdf.
Â
Calculated from data in graph.
Â
“Nuclear Power in Germany,†World Nuclear Association, March 2014. Accessed March 5, 2014. Available at: http://www.world-nuclear.org/info/Country-Profiles/Countries-G-N/Germany/.
Â
“Armchair warriors wage a phoney war,â€Â Petroleum Economist, March 10, 2014. Accessed March 11, 2014. Available at: http://www.petroleum-economist.com/Article/3317637/Armchair-warriors-wage-a-phoney-war.html.
Â
Subscribe
Get updates whenever new content is added. We'll never share your email with anyone.