Memo Published October 5, 2011 · Updated October 5, 2011 · 8 minute read
United States vs. Europe — Through the Looking Glass
David Hollingsworth & Lauren Oppenheimer
Europe and the United States are each facing a debt problem. But that’s where the similarity ends. A look at key numbers that predict future debt levels and capacity for economic growth shows that—if we act aggressively and decisively now—we can reasonably solve our debt problem, while Europe’s task is exponentially more difficult.
Economically, fiscally, and demographically, Europe waited far too long to recognize the inevitable and make the changes necessary to stave off a full-blown crisis—changes that, taken early enough, would have been modest. But European leaders buried their heads in the sand, were afraid to confront voters with the truth, and now face draconian measures to improve their fiscal situation.
Today, the U.S. is in better shape than Europe. It has a stronger economy with lower levels of taxes and spending, younger demographics, and a smaller public pension system. But Congress should make no mistake: our future is likely to be similar to Europe’s if we do not heed the warnings coming from across the Atlantic.
To avert Europe’s fate, it is vital for the Super Committee to, at a minimum, offer a balanced deficit reduction package that hits the $1.2 trillion target, addresses at least some of America’s revenue shortfalls, and reins in some entitlement growth—not as a complete solution but as an essential next step. The bottom line is that ten years ago, Congress could have used a scalpel to solve our long-term debt crisis; today it will take a knife. In Europe, it will take a chain saw.
Europe: A Case Study of the Dangers of Debt Delay
In this memo, we describe three of the major areas in which Europe’s inaction have had severe consequences for their fiscal future, and why each should be a warning to U.S. policymakers.
The Budget—A Knife vs. a Chainsaw
The European countries represented in Table A have higher levels of taxation, spending, and debt than the United States. This makes it far more difficult for these nations to solve their debt crisis without wrenching structural changes in their economies and vast alterations to their retirement systems, lowering living standards.
However, while the U.S. has more wiggle room to cut spending and raise revenues than Europe, without serious action now our future could be just like Europe. These sensational European headlines could be in future U.S. newspapers if we are not careful: “EU leaders must act decisively or face disaster, says IMF” 1 and “Europe at the Brink.”2
As Kenneth Rogoff and Carmen Reinhart note, when GDP to debt ratios reach a certain level, economic growth is significantly slowed.3 If we fail to change course, the Congressional Budget Office estimates that we will reach Portuguese debt to GDP ratios by 2019, Irish levels by 2020, Italian levels by 2025, and Greek levels by 2029. This is why the U.S. must begin to address its deficit situation.
And as long as additional revenue is part of the equation we only need to trim spending, not hack it off. European countries cannot simply trim spending to reach reasonable deficit levels.
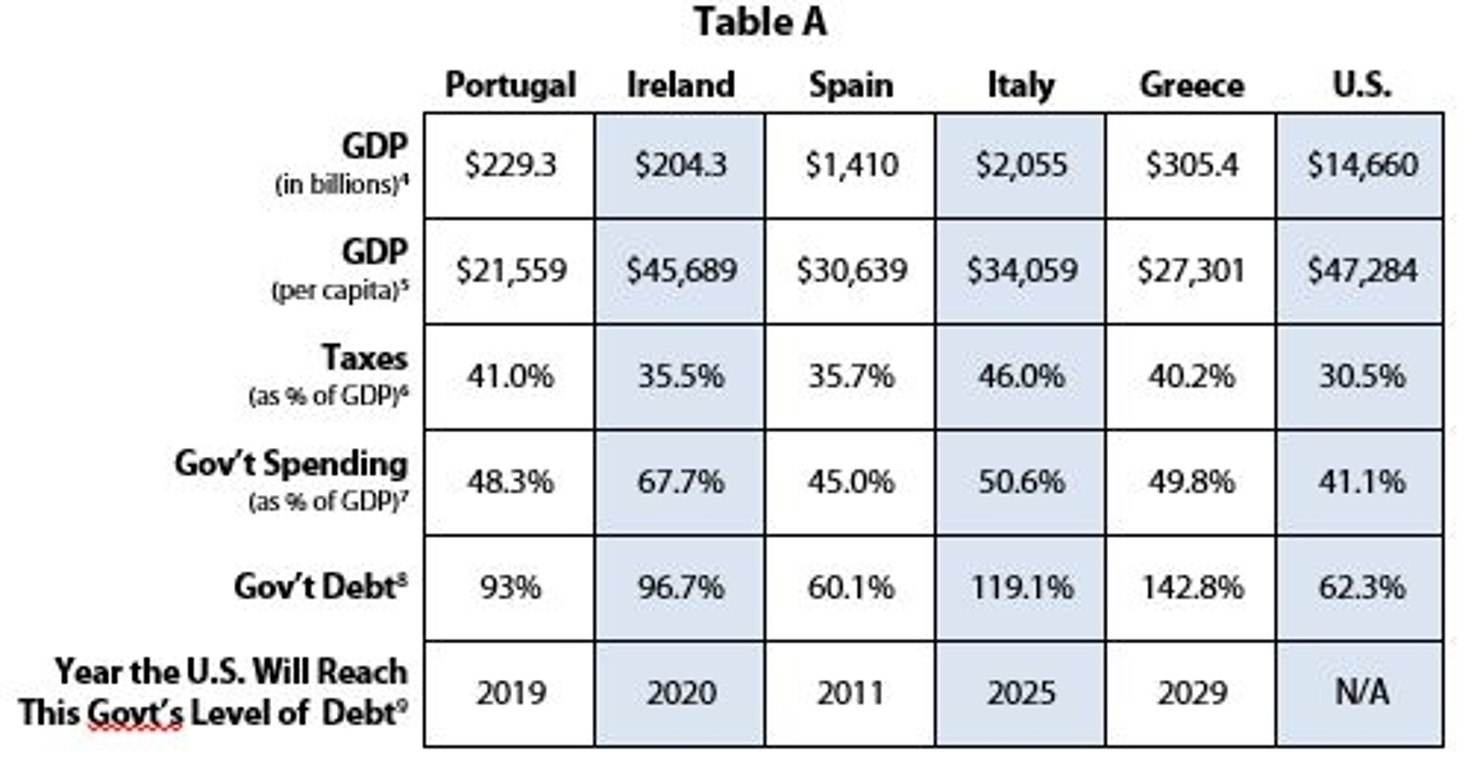
Chart endnotes: 4 567 8 9 10 11 12
Demographics—Workers vs. Retirees
In general, working age people produce economic growth and pay taxes; elderly people reduce economic growth and consume taxes by receiving government benefits. As Table B shows, except for Ireland, these troubled European countries lack a large enough working population to pay for current retirees and they will struggle mightily to afford a vast and expensive elderly population in the future. The United States, too, has a graying problem. Over the next 40 years, the number of elderly will double while the number of working age people will increase by only one-third. This will likely reduce growth.
But the United States has higher birth rates than Europe and we have the largest immigrant population in the world. There is very little European countries can do about birth rates and they have been hesitant to expand immigration beyond internal European Union population movement. Their demographics portend an aged population and a slowing economy. The United States needs only to tweak its current immigration system and deal intelligently with the current undocumented population to improve these ratios.

Chart endnotes: 13 14 15 16 17
Retirement Entitlements—Renovate vs. Rebuild
The European countries in this chart have overly generous retirement systems, which are fantastic until you have to pay for them. As noted above, there are not nearly enough people of working age to cover European retirement costs at their current benefit levels, and it only gets worse in the future.
The United States has a comparatively thrifty retirement system, with a higher full retirement age and a more modest wage replacement rate than all the listed countries but Ireland. Even with our more modest public pension plan, tweaks must be made to keep it solvent—a slow and gradual lifting of the retirement age, tiny alterations to cost-of-living-adjustments (COLAs), and a bit more revenue from higher income workers, to name a few. Modest changes will have little to no effect on the European retirement crisis. The United States must renovate its retirement system; Europe must completely rebuild theirs.

Chart endnotes: 18 19 20
The United States vs. Europe: Limitations of a Comparison
The United States and the listed European countries—which are members of the euro currency union—do have differences that prevent exact comparisons. For one, Europe has a monetary union but not a fiscal union. This means that the European Central Bank controls monetary policy but has no control over the spending and tax policies of member nations. The United States has a federal system with a national monetary and fiscal policy, and has formal mechanisms that redistribute revenue and wealth from more productive to less productive states.
Europe does not have such a structure, which means that the sovereign debts of individual European countries are more susceptible to market pressure than the debt of the United States, the U.K. or Japan. For example, according to the Tax Foundation, New York receives only 79 cents back for each dollar it contributes in federal tax revenue, while Mississippi receives $2.02, making it a net recipient of federal tax dollars.21 Thus, New York is America’s “Germany” and Mississippi is more akin to “Spain.” And while this might infuriate some New Yorkers, it is an overall strength for our nation.
Another difference between Europe and the United States is health care spending and the structure of their health care systems. The European countries listed in these charts spend from 9%-11% of their GDPs on health care, where the United States spends 16% of GDP on health care.22 Yet despite this extra spending, the United States is ranked as the 37th best health care system by the World Health Organization—far lower than Ireland, which is the worst performing listed European country and is ranked 19th overall.23
While the amount of GDP the United States spends on health care is a fundamental concern for our future fiscal health, there is also a silver lining: it indicates that the United States—with the right policies—can significantly reduce health care spending as a percentage of GDP without sacrificing health care quality or outcomes. Some of those steps were taken in the Affordable Care Act. On the other hand, it will be hard for these European countries to reduce their spending without lowering standards of care.
Conclusion
You can't pick up a newspaper today without reading about the potentially devastating financial consequences of Europe's sovereign debt crisis. Starting with turmoil in Greece, this crisis has run from European capitals to capital markets.
These troubled European countries put off tough decisions about taxation, spending, and pension issues until it was too late. The result has been to bring European financial markets to the brink, as the sovereign debt troubles of these countries have led to solvency questions about the European banking sector.
This saga shows that government actions do not occur in a vacuum, but have important effects on financial markets as well. Healthy capital markets are essential for economic growth, yet it is extremely difficult to have healthy capital markets if sovereign finances are in disarray.
U.S. policymakers must heed this warning from Europe. They must make the modest reforms necessary to maintain our fiscal stability before it is too late.