Taxes Are Below Historical Averages

Taxes Are Below Historical Averages

Shutterstock 324599615 HG
Photo of Zach Moller
Director of the Economic Program

To justify tax cuts, Republicans often claim that record-high levels of federal revenue are flowing to the federal government. They also state that tax revenue is in line with or above a “50-year average” as a share of GDP. The problem is: both claims aren’t true. Below, we provide a snapshot of federal revenue over time and examine how the GOP tax bill would make things worse.

Five Facts on Tax Revenue

Revenue, in nominal terms, tends to grow each year—just like the price of bread or clothes. That’s why it’s important to measure revenue in relation to the size of the economy. Here are five facts to know about tax revenue:

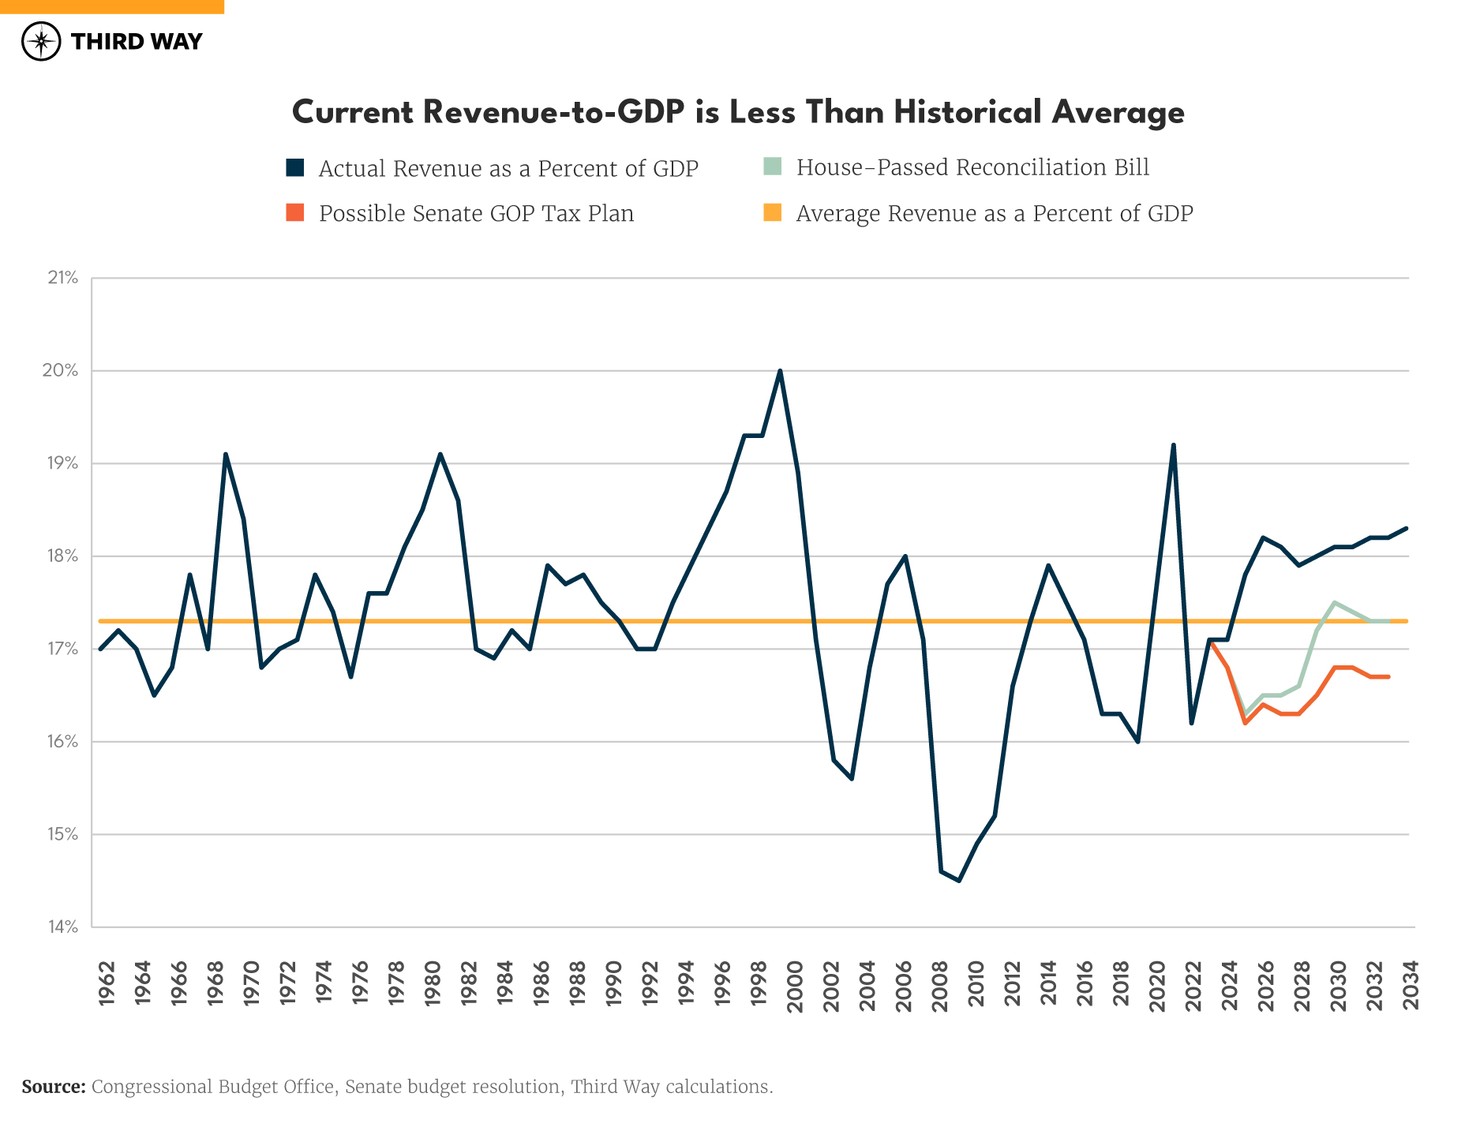
  1. Current tax revenue is below the long-term average. Revenue is estimated to be 17.1% of gross domestic product (GDP) for FY 2025, roughly the same as last year (FY 2024).1 The 50-year revenue average is 17.3%.2
  2. Revenue has exceeded 19% of GDP only six times since 1962. That happened in 1969, 1981, 1998, 1999, 2000, and 2022. But, during the end of the Clinton Administration, higher revenues correlated with budget surpluses.
  3. The recent revenue high of 19.2% of GDP in 2022 was an anomaly. The Congressional Budget Office (CBO) attributed this revenue bump to higher capital gains realizations and other timing shifts related to tax policy around the pandemic. This was not due to the Trump tax cuts growing the economy.3
  4. Historic revenue averages are not a good target. Tax revenue should pay for federal spending as well as improving our future fiscal picture. Looking backwards to historical averages doesn’t account for where the country is—or where it’s going.
  5. A higher revenue target is needed. If we want to keep our promises to the middle class and seniors—and not default on the debt—we need a tax code that brings in more money. The last great fiscal commission (Bowles-Simpson from 2011) suggested revenue at over 20% of GDP.4 The last time we had a balanced budget (1998-2001), revenue was around 19% of GDP.5

The New GOP Tax Plan Shrinks Revenue

If the 2017 Trump tax cuts were to expire at the end of this year, revenue would come in around 18.3% of GDP by the end of the decade (FY 2035).6 Current Republican plans, however, would significantly shrink what the government can afford:

  • The House version of the Trump tax cuts slash revenue. The House-passed reconciliation bill results in revenues falling below 17% of GDP for the first five years after enactment and settling at 17.3% of GDP by the end of the decade as the bill’s temporary tax cuts expire.7
  • Senate Republicans can make a tax plan that would push revenues well below the historical average. Some Republicans are pushing to go even further than the House bill. Under a scenario where an additional $1.5 trillion in tax cuts are enacted beyond the House bill—as allowed under the reconciliation instructions—revenue would fall to 16.3%.8 That level is a full percentage point below the historical average. If the cuts are used to extend some things the House would have let expire, it would stay below 17% through the end of the decade.9
Image Alt Text
Topics
  • All Topics
  • Budget133
  • Taxes101

Endnotes

  1. Congressional Budget Office. “The Budget and Economic Outlook: 2025 to 2035.” Congressional Budget Office, 17 January 2025, https://www.cbo.gov/publication/60870. Accessed 12 June 2025.

  2. Congressional Budget Office. “Historical Budget Data, Supplement to The Budget and Economic Outlook: 2025 to 2035.” Congressional Budget Office, 17 January 2025, https://www.cbo.gov/data/budget-economic-data#2. Accessed 12 June 2025.

    The 50-year average of 17.3% is the same as if we look back to 1962, when the series starts in the CBO budget table. Analyzing Office of Management and Budget historical tables that go back as far as 1930, the historical average is 15.6% of GDP. However, this average includes the Great Depression years when revenue averaged just 5.3% of GDP; revenues did not exceed 10% of GDP until World War II (including a peak of 20.5% of GDP in 1944).

    For more information, see Office of Management and Budget. “Historical Tables, Table 1.2—Summary of Receipts, Outlays, and Surpluses or Deficits as Percentages of GDP: 1930–2029.” Office of Management and Budget, 29 February 2024, https://bidenwhitehouse.archives.gov/omb/budget/. Accessed 4 February 2025.  

  3. Congressional Budget Office. “Monthly Budget Review: Summary for Fiscal Year 2022.” Congressional Budget Office, 8 November 2022, https://www.cbo.gov/publication/58592/html. Accessed 12 June 2025. And; Congressional Budget Office. “Historical Budget Data, Supplement to The Budget and Economic Outlook: 2025 to 2035.” Congressional Budget Office, 17 January 2025, https://www.cbo.gov/data/budget-economic-data#2. Accessed 12 June 2025. And; Office of Management and Budget. “Historical Tables, Table 1.2—Summary of Receipts, Outlays, and Surpluses or Deficits as Percentages of GDP: 1930–2029.” Office of Management and Budget, 29 February 2024, https://bidenwhitehouse.archives.gov/omb/budget/. Accessed 4 February 2025.  

    CBO’s historical budget data provides a 19.2% revenue as a percent of GDP level for FY 2022. CBO’s final monthly budget review for FY 2022 reported a 19.6% of GDP revenue level for FY 2022, and OMB historical tables reported a 19.4% of GDP revenue level for FY 2022.      

  4. Ayres Steinberg, Sarah, and Linden, Michael. “How Much Revenue Was in Simpson-Bowles?” Center for American Progress, 15 November 2012, https://www.americanprogress.org/article/how-much-revenue-was-in-simpson-bowles/. Accessed 12 June 2025.

  5. Congressional Budget Office. “Historical Budget Data, Supplement to The Budget and Economic Outlook: 2025 to 2035.” Congressional Budget Office, 17 January 2025, https://www.cbo.gov/data/budget-economic-data#2. Accessed 12 June 2025.

  6. Congressional Budget Office. “The Budget and Economic Outlook: 2025 to 2035.” Congressional Budget Office, 17 January 2025, https://www.cbo.gov/publication/60870. Accessed 12 June 2025.

  7. Congressional Budget Office. “Estimated Budgetary Effects of H.R. 1, One Big Beautiful Bill Act.” Congressional Budget Office, 4 June 2025, https://www.cbo.gov/publication/61461. Accessed 12 June 2025.

  8. Third Way estimate based on Congressional Budget Office. “Estimated Budgetary Effects of H.R. 1, One Big Beautiful Bill Act.” Congressional Budget Office, 4 June 2025, https://www.cbo.gov/publication/61461. Accessed 9 June 2025. And; Congress.gov. "H.Con.Res.14 - 119th Congress (2025-2026): Establishing the congressional budget for the United States Government for fiscal year 2025 and setting forth the appropriate budgetary levels for fiscal years 2026 through 2034." Library of Congress, 10 April 2025, https://www.congress.gov/bill/119th-congress/house-concurrent-resolution/14/text. Accessed 7 May 2025. And; Congressional Budget Office. “The Budget and Economic Outlook: 2025 to 2035.” Congressional Budget Office, 17 January 2025, https://www.cbo.gov/publication/60870. Accessed 12 June 2025.

  9. This method assumes the potential for $3.7 trillion in revenue losses as estimated by the CBO score of the House-passed reconciliation bill as well as the $1.5 trillion of increased deficit allowed by the Finance Committee instruction in the final FY 2025 budget resolution. Our assumed path for adding in the $1.5 trillion of further revenue loss is weighted to give the latter five years of the 2025-2034 budget window 80% of the additional cuts. This is result of media reports that Senate Republicans have requested fewer temporary tax cuts and more permanent cuts.

Subscribe

Get updates whenever new content is added. We'll never share your email with anyone.