Memo Published May 18, 2023 · 5 minute read
Different Places, Different Housing Markets
Anthony Colavito

Nationwide, one-in-three American households are struggling with housing costs.1 But the housing story in this country is not a simple tale–different cities are experiencing different housing situations. In this memo, we explore variation in local housing trends, examine cases where some cities excel while others struggle, and discuss how solving the housing crisis is more complicated than it appears.
Rising Supply Tamps Down Price Increases
Construction of new housing can moderate—or even reverse—the cost of housing. A diverse range of research backs this up:
- A study of San Francisco found that new construction lowered rents and decreased the risk of displacement to lower-income neighborhoods by 2% and 17%, respectively.2
- A study of New York City found that for every 10% increase in the housing stock, rents fell by 1% and sales prices decreased within 500 feet of construction.3
- Internationally, a study showed new construction frees up older units, creating slack in the housing market in middle- and low-income areas.4
Altogether, a review of the academic literature found “that adding new homes moderates price increases and therefore makes housing more affordable to low- and moderate-income families.”5
We’re seeing this play out in practice in the United States. Cities that produce housing at rates that match or exceed population growth can tame rent increases. In some cases, municipalities are building housing fast enough to keep cost growth from rising above the national average.
Between 2017 and 2019, median rents of new leases rose by 5.7% nationally.6Yet, in Atlanta, Minneapolis, Oklahoma City, and Portland, the rise in median rents fell below that figure.7
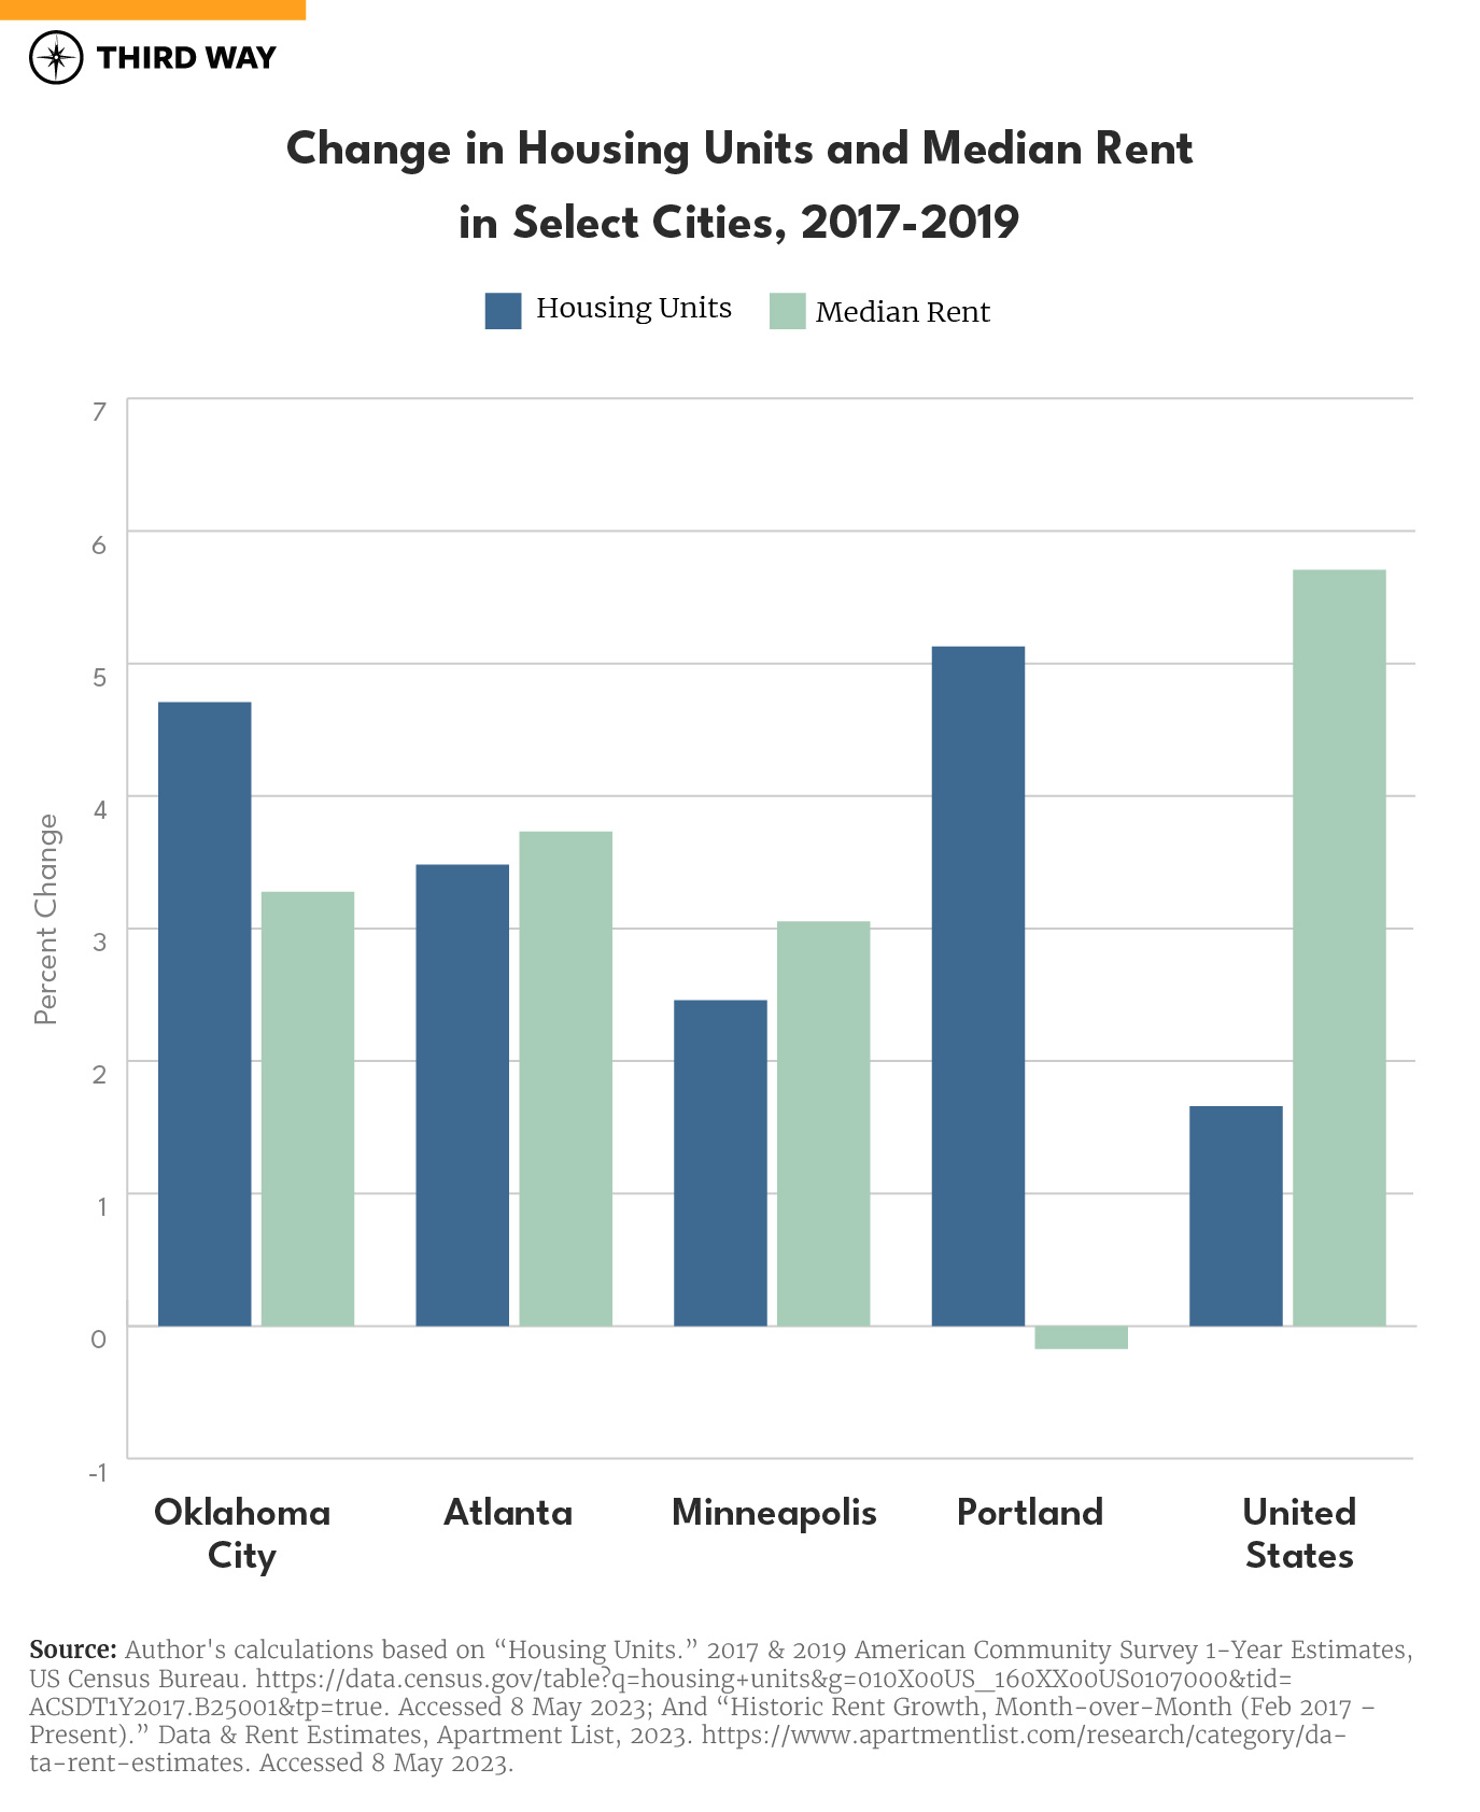
Population growth in these cities rose above the national level.8 That growth put pressure on local housing markets as more and more people competed for a place to live. But as people moved in, these cities built housing fast enough to mitigate rising demand.9 In Portland, for example, the growth in the housing stock was large enough to lead median rents to fall between 2017 and 2019. In Oklahoma City, median rents grew over this period, but the pace at which new housing became available helped rental cost growth stay under 3.5%.10 Atlanta and Minneapolis also saw below average rent increases, showcasing the benefits of added housing supply.11
Slow Housing Growth Can Drive Up Costs
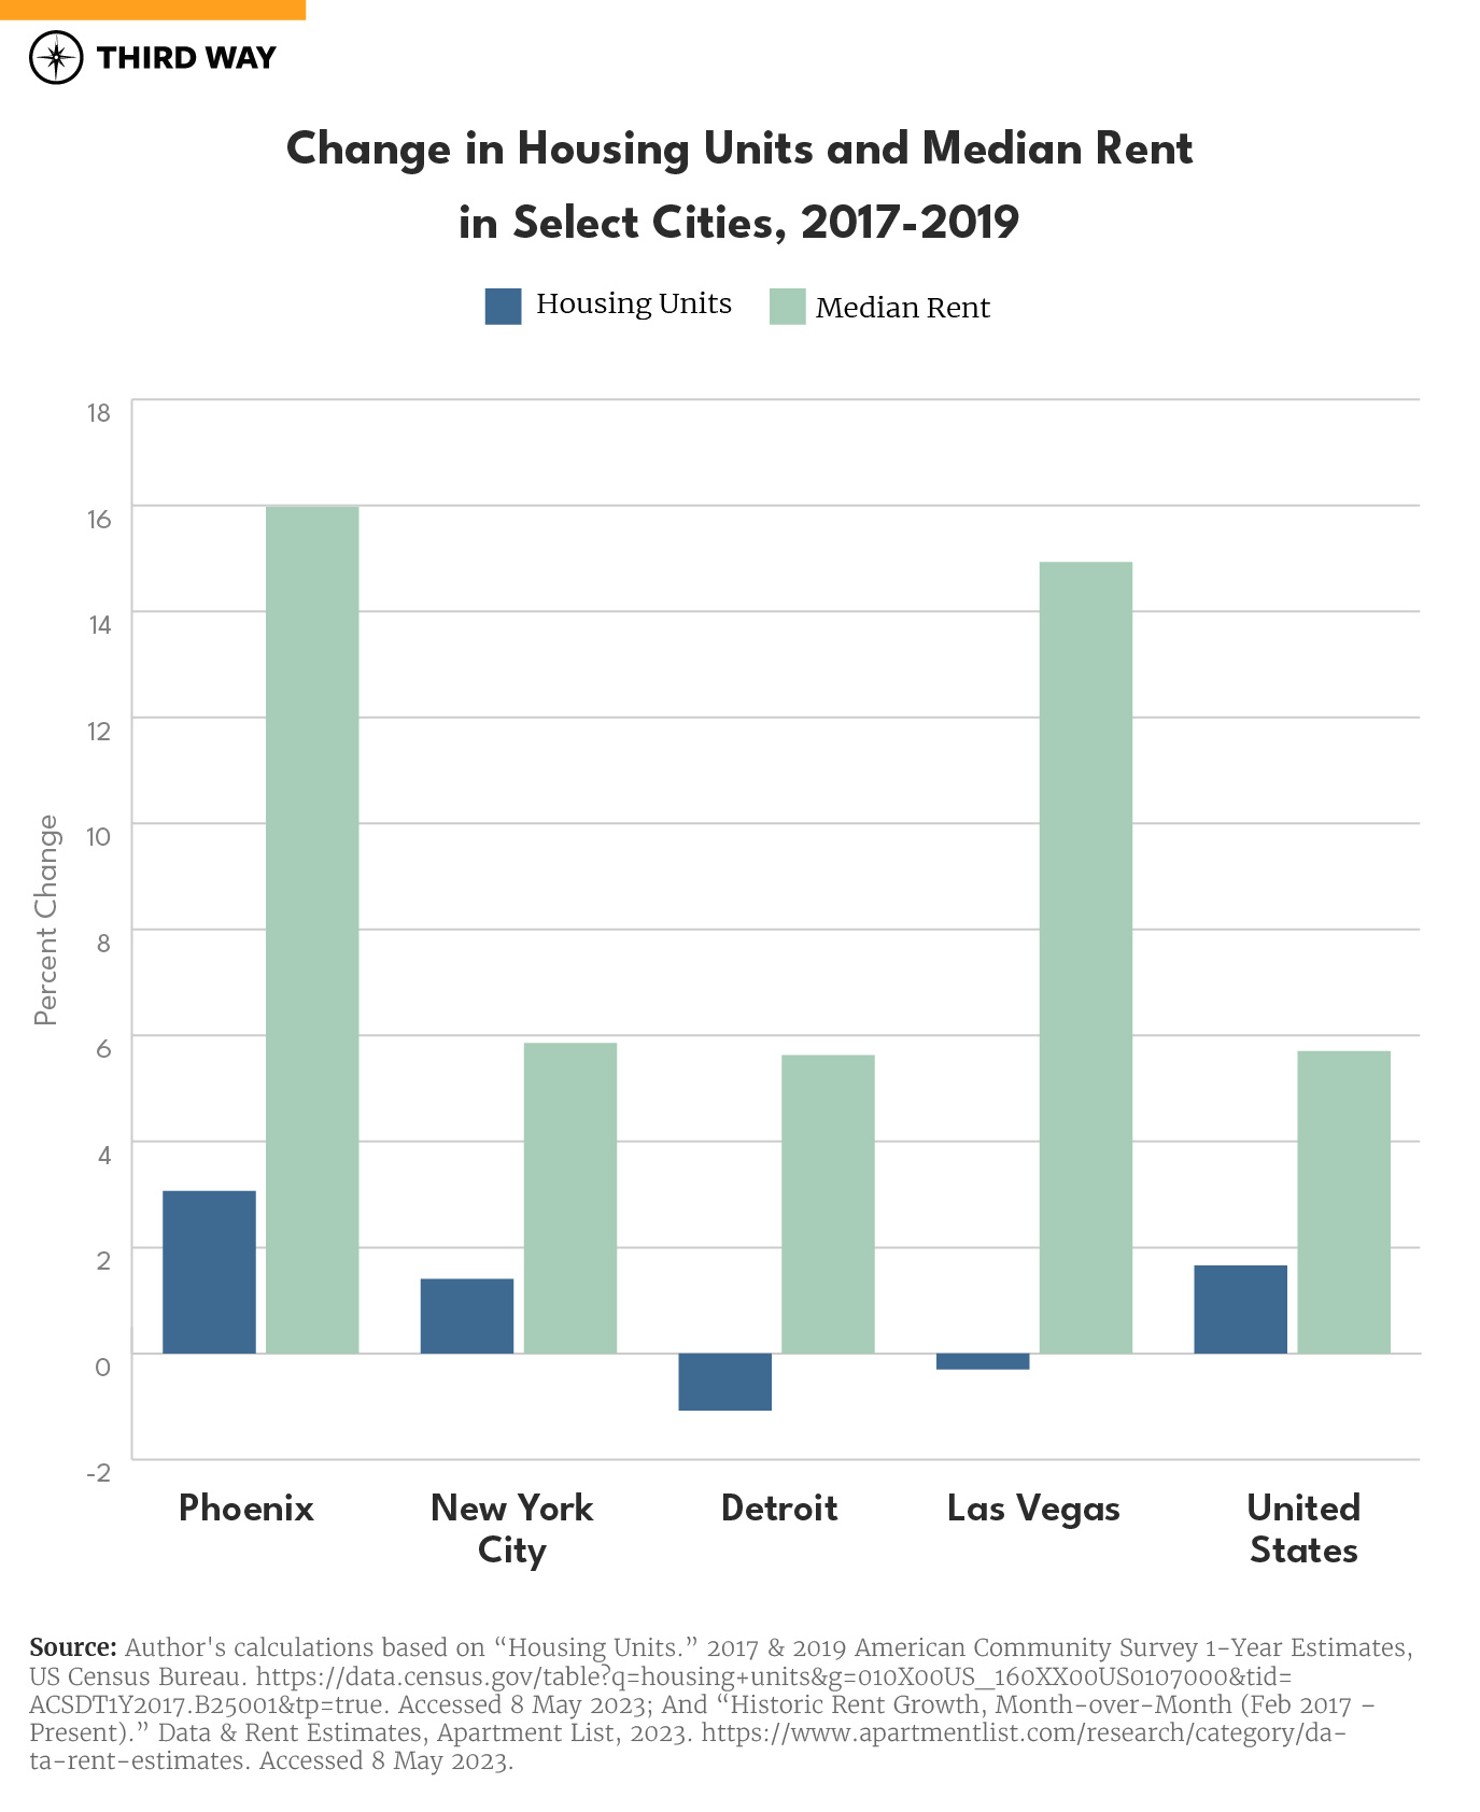
In other cities, however, the housing picture isn’t nearly as rosy. In many places, housing supply failed to match rising demand, or decreased faster than people moved out. In Phoenix, for example, new housing was built, but it was slower than population growth—putting upward pressure on rents in the city. In Las Vegas, on the other hand, the number of housing units fell even as its population grew.12 And in Detroit, the housing stock declined even faster than people moved out of the city.13 New York City, too, saw a pace of construction slow enough that the resulting rise in housing costs contributed to people moving out of the city, even before the global pandemic.14
Just as the housing story differs from city to city, the reasons for a housing shortage differ. In some places, like New York City, Phoenix, and Las Vegas, policies such as density limits, height restrictions, and parking requirements restrict the development of new housing. But in other places, like Detroit, loosening supply constraints will fail to help if developers do not want to build there to begin with. In these places, housing supply may be dwindling due to an uncertain economic future. Without an ample supply of good jobs, rising incomes, and a steady population, it may not pencil out to homeowners and landlords to refurbish existing housing.
There Is More To Housing than Meets the Eye
There is a limit to only comparing housing growth to rent growth though. Other factors muddle the picture. The rise of remote work during the pandemic changed where and how much housing people wanted. Between the start of the pandemic and 2022, nearly 5 million Americans, or 2.4% of all people, moved to a new location because of remote work.15 In many cases, white-collar workers in cities like New York City, San Francisco, and Boston decided to decamp and move to less crowded towns in the suburbs and countryside, places where they could purchase bigger homes with more amenities like home offices.
And one study suggests that remote work led to a surge in household formation and thus higher demand for housing.16 So even as populations declined in some places, demand for housing through new family formation rose nonetheless.
Conclusion
The state of the housing market varies across the country. Some places are seeing price increases while others are seeing cost declines. At the same time, cities are building housing at different paces even as they are hit by forces like those resulting from remote work. As policymakers consider ways to make housing more affordable, they must be aware of the ways in which supply and demand interact to cause prices to rise or fall—and how other forces, like remote work and job opportunities, have an impact.