Report Published August 5, 2015 · Updated August 5, 2015 · 8 minute read
Losing Ground in Asia: Why the U.S. Export Market Share Has Plummeted
Jay Chittooran
It is impossible to ignore the explosion of growth in Asia. With many countries in the region growing at nearly double-digit rates, as well as seeing rising populations and higher incomes, Asia has emerged as a regional leader in the global economy. China, Asia’s de facto leader, has spearheaded its own development bank, which has wide global support, and the renminbi is on the cusp of becoming a reserve currency. In response, President Obama’s foreign policy has included an Asia Pivot, a core component of which is the Trans-Pacific Partnership (TPP).
Despite this policy shift, when it comes to economic performance in Asia, America is failing.
This report examined 26 entities (25 countries, including the United States, as well as the combined rest of world) and their share of the Asian import market from 2000 to 2014. (See the Appendix for a detailed methodology.) These 25 countries represent the top exporters into the leading 15 Asian economies (A15), covering more than 80% of all exports into the region.
Building on a previous Third Way report, we used new data to reexamine America’s export share in Asia and how America stacked up against other countries. Based on this new data, we found:
- The Asian import market grew by 261% between 2000 and 2014, from $1.5 trillion to $5.4 trillion.
- Despite the Asian market boom, the U.S. market share fell by 46%, the biggest drop of any of the 25 largest exporters into Asia except Japan.
- While U.S. market share in Asia is fading, China has been the largest beneficiary.
Finding 1
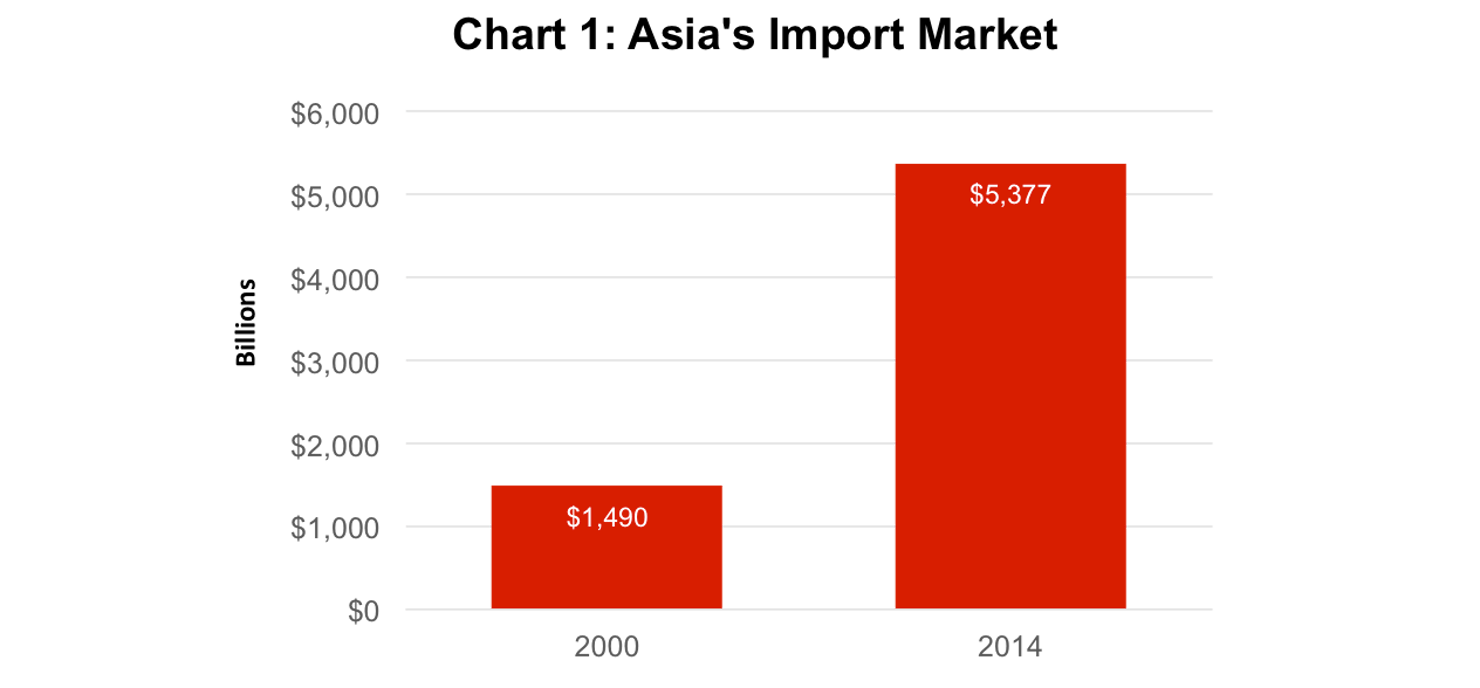
The Asian import market grew by 261% between 2000 and 2014, from $1.5 trillion to $5.4 trillion.1
The Asian import market is exploding with growth. Specifically, the market size of the 15 leading Asian economies* has grown by 261%, from $1.5 trillion in 2000 to $5.4 trillion in 2014. (See Chart 1: Asia's Import Market.) Its growth rate soared to over 10% in the pre-global financial crisis era and since then has nevertheless maintained strong growth at around 7.5% in 2014. And this growth has been shared among nearly all of the 15 Asian economies.
* The 15 Asian economies we analyzed included: Brunei, Cambodia, China, Hong Kong, Indonesia, Japan, Laos, Malaysia, Myanmar, Philippines, Singapore, South Korea, Taiwan, Thailand, and Vietnam.
This dramatic increase of the Asian import market is a result of strong growth, increased trade, a reduction in trade barriers, and other open market practices that have encouraged private enterprise and government investment and support. As these economies have grown, their respective populations have consumed and imported more. At the same time, the number of consumers in Asia is rapidly growing: the Asian middle class population is expected to be 1.2 billion in 2020 and will hit 3.2 billion by 2030, which will be over 2/3 of the world’s entire middle class.2
Finding 2
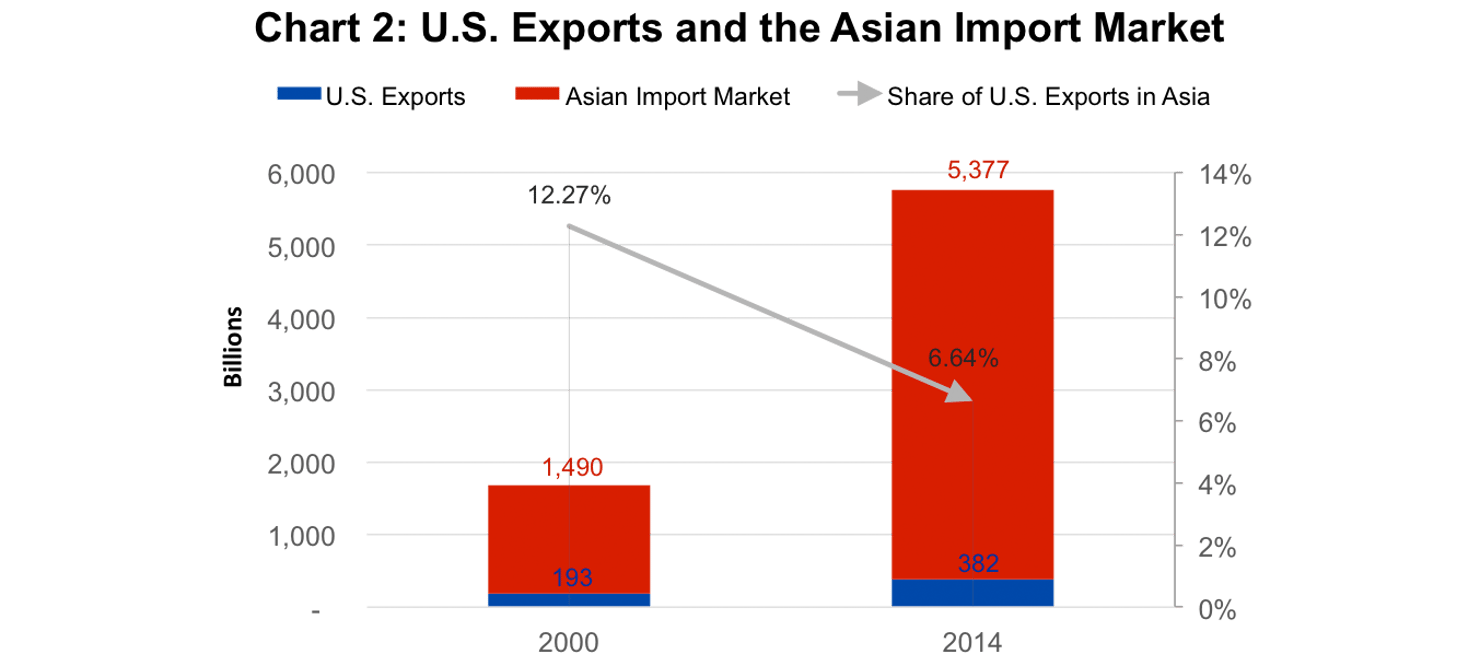
Despite the Asian market boom, the U.S. market share fell by 46%, the biggest drop of any of the 25 largest exporters into Asia except Japan.
In 2000, U.S. exports accounted for 12.3% of the Asian import market. Yet, 14 years later, U.S. exports shrank to just 6.6% of the Asian market. (See Chart 2: U.S. Exports and the Asian Import Market.) U.S. market share fell despite American exports to Asia doubling (growing from $192 billion in 2000 to $382 billion in 2014). The reason is that the overall Asian import market has grown at almost triple that rate. As a result, U.S. market share has declined by 46% since 2000.
One would expect U.S. market share to decline simply because of the emergence of China. But China’s rise should result in equal declines from all countries, especially high-wage countries. However, only Japan, with a 51% decline in market share, fared worse than the United States. And Japan’s poor performance stemmed from a series of unique economic woes (the 2011 earthquake and Fukushima nuclear disaster) on top of a decades-long stagnant economy. Most other high-wage countries experienced some loss of market share, but no country compared with the United States. The United Kingdom’s market share fell by 36%, France by 16%, and Germany and Switzerland were essentially flat. Korea (+6%) and Australia (+40%) each had solid gains. Brazil, Qatar, and Russia, all of whom have are large energy exporters, led the change in export market share by 207%, 149%, and 139%, respectively. The rest of the world group increased their market share by 5%.
Table 1: The Changing Market Share of the Major Exporters into Asia, 2000-2014 (See Appendix) outlines the complete list of exporters and their market shares in 2000 and 2014.
Had it maintained its market share in Asia in 2014, the United States would have added an additional $275 billion in exports.
Finding 3
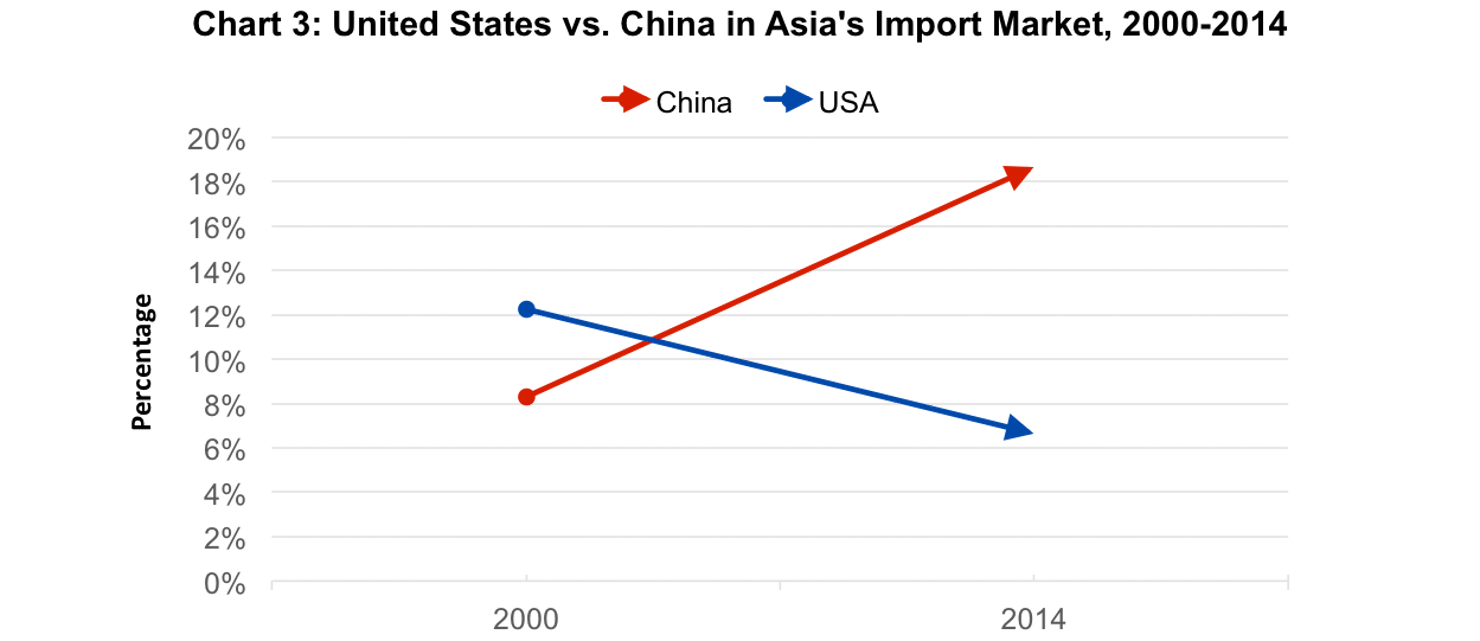
While U.S. market share in Asia is fading, China has been the largest beneficiary.
While the U.S. share has been cut in half in under 15 years, China’s share of the Asian import market has increased by 125%. China’s share of the Asian import market was 8.3% in 2000; by 2014, it comprised 18.7% of the total Asian import market. (See Chart 3: United States vs. China in Asia's Import Market, 2000-2014.) How did China seize this growth? During this period, China’s economy grew rapidly, partly by joining numerous trade agreements and reducing barriers to trade. These factors, combined with a strengthened domestic, low-skill manufacturing sector, contributed to their comparative advantage in sending exports abroad. From 2000 to 2014, China went from the third-largest exporter in terms of value of exports to the largest, supplanting the United States at the top and pushing Japan to the third position.
Among the top 25 exporters into this region, China’s export share growth was the fourth fastest, only behind largely energy exporting countries of Brazil, Russia, and Qatar.
Conclusion
The decline in U.S. market share in Asia shouldn’t come as a complete surprise. One would expect some change with the rise of China. But America’s decline is the worst among all major competitors in the region, with the exception of Japan.
Since 2000, there have been about 180 trade deals concluded worldwide, and the United States was party to only 12, covering 17 countries.3 While trade deals always rile Congress, the lack of them has meant that the United States has given up export opportunities in Asia.
Over the next several months, the United States and 11 nations are expected to conclude negotiations on the TPP. This is a sure fire way to increase U.S. market share in these important Asian economies. The global economy is projected to grow by over $60 trillion in the next 15 years, and almost 90% of that will occur outside of the United States, making global commerce an even larger part of future American success.4 By tapping into these lucrative markets, the United States can retake its lost share of these expanding economies, which means more wealth and prosperity for the middle class and the U.S. economy.
Appendix
To determine the extent that America’s share of the Asian market has changed since the turn of the century, we built a group of 15 Asian economies that we call A15. This group of Asian countries includes: Brunei, Cambodia, China, Hong Kong, Indonesia, Japan, Laos, Malaysia, Myanmar, Philippines, Singapore, South Korea, Taiwan, Thailand, and Vietnam.
Exports to the A15 were analyzed for 26 entities—25 countries (including the United States) as well as the combined rest of world. These 26 entities cover the top 20 exporters into A15 in 2014 as well as 5 other countries (United Kingdom, Italy, Philippines, Canada, and Hong Kong) that were in the top 20 in 2000. Exports data was calculated using the International Monetary Fund’s Direction of Trade Statistics (DOTS) database. Taiwan’s trade data was incomplete in the DOTS database, but by using data mirroring, we were able to calculate Taiwan’s imports and exports.
The total A15 import market in 2000 was $1.5 trillion, and it was $5.4 trillion in 2014. However, of the A15 countries, 11 countries are part of the ‘26 entities’ category. If a country is on both sides of the equation (part of the 26 entities and part of the A15), this, then, implies that a country is trading with itself. To adjust for this, we removed each of the 11 countries’ imports from the A15 group total and then calculated their share. Therefore, for EA 15 countries such as China, Japan, etc., we subtracted out their imports to A15 from the A15 total.
To calculate each country’s share of the A15 import market, we divided the 2000 exports into the updated 2000 A15 import market.
Because of different denominators (as a result of the changing A15 import market size), we normalized the data by taking the difference and distributing weighted values, commensurate to their export market size, to each of the 26 entities. Weights were assigned so countries like China and the United States, who export heavily into this region, take more of a hit, and those who export less do not take such a large hit.
We followed the same pattern for 2014. We found out exports, the size of the total A15 import market, and calculated each country’s share.
To see the change in market share from 2000 to 2014, we simply calculated the delta.
From this, we can see that the share of the U.S. import market has shrunk by 46% from 2000-2014, only being outdone by Japan. While other countries, like Brazil, China, and the rest of the world are growing in their share of the region.
Table 1: The Changing Market Share of the Major Exporters into Asia,
2000-2014
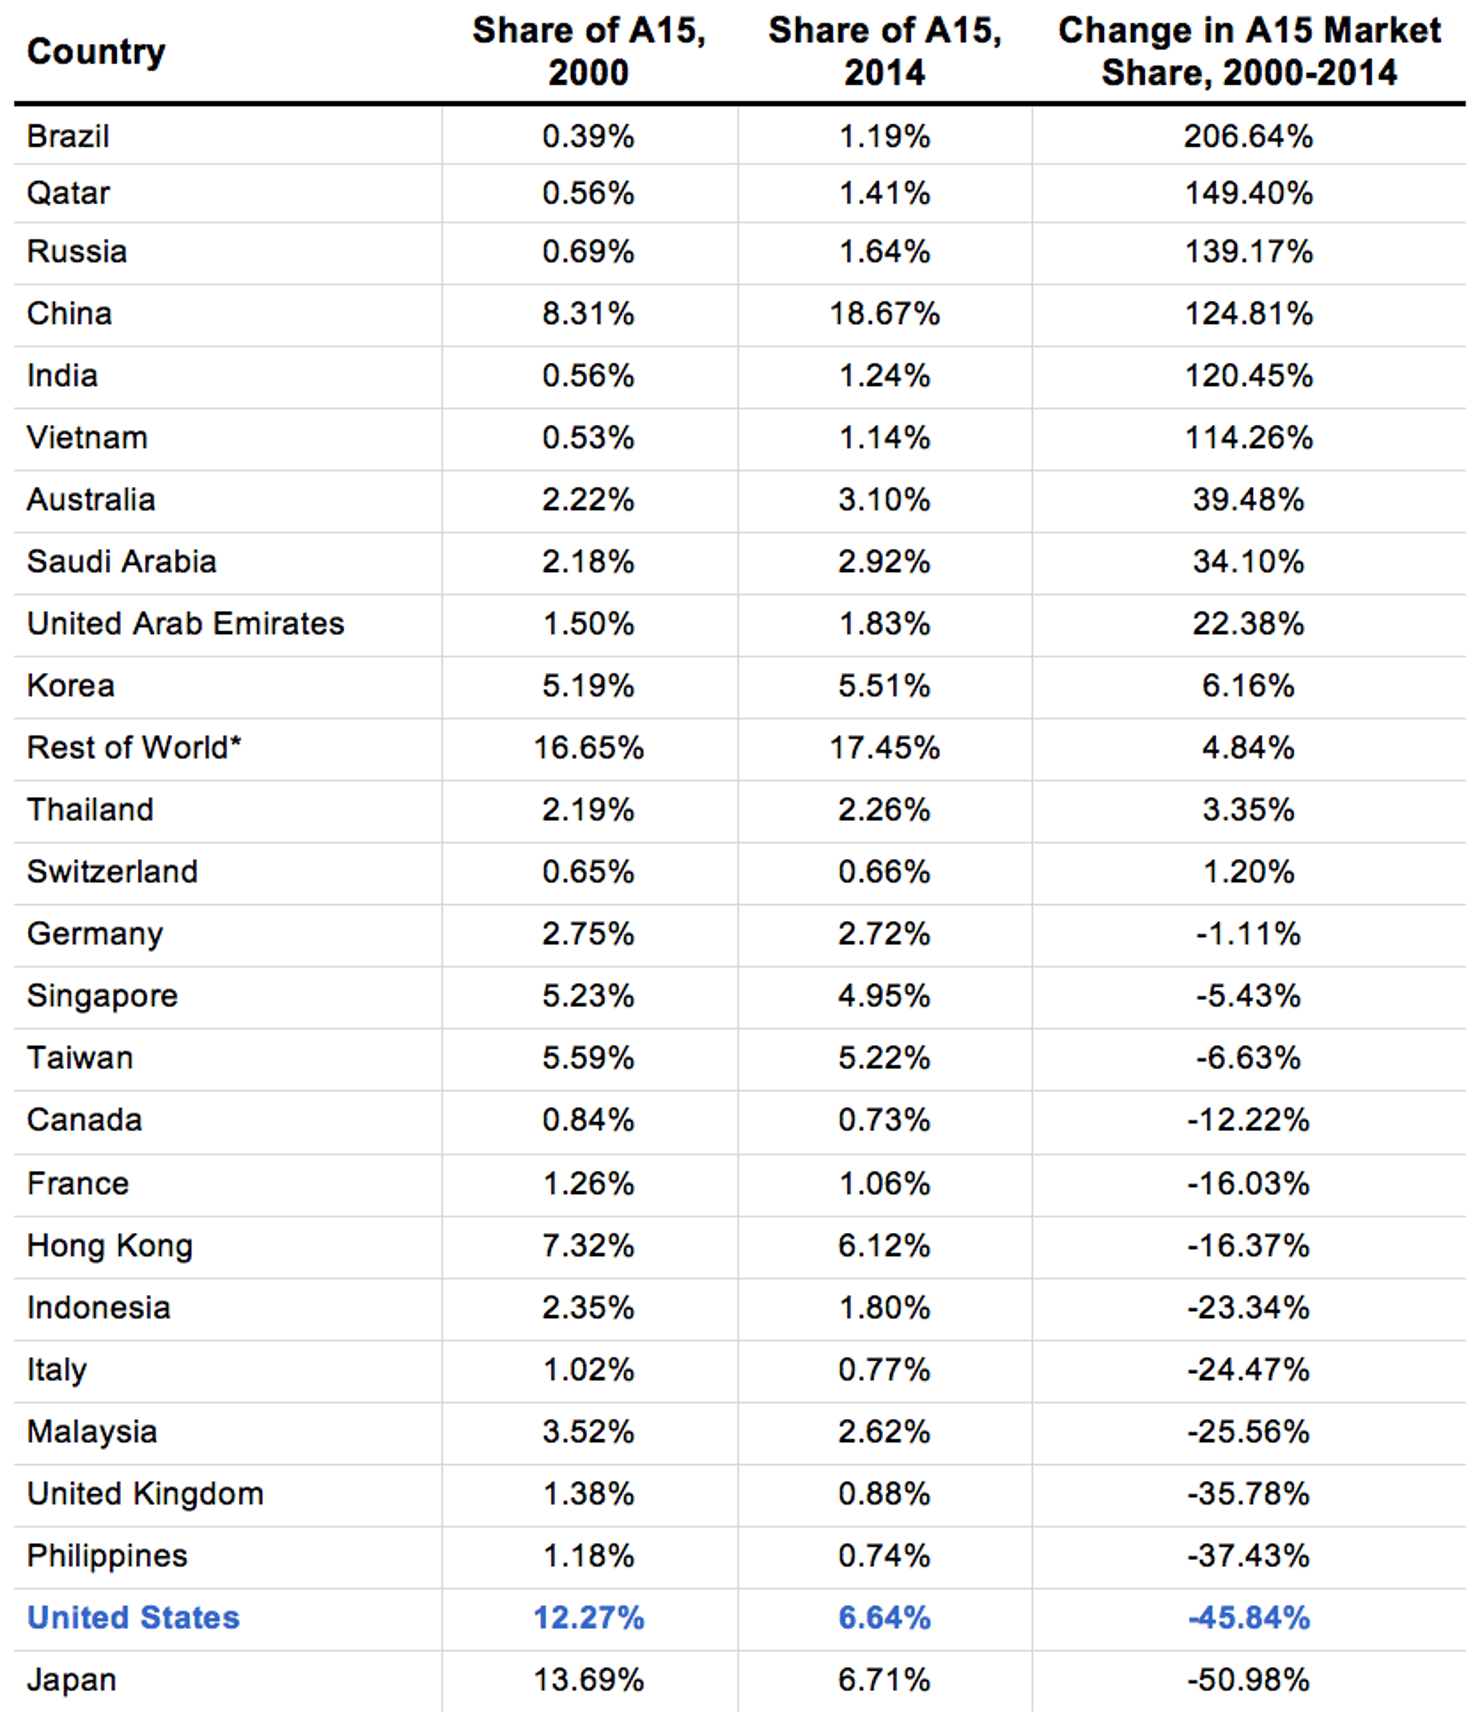
* The Rest of World group includes all other countries that export in A15, excluding those listed separately.