Report Published October 21, 2014 · Updated October 21, 2014 · 15 minute read
A Partisan Deal on Job Creation
David Brown
Since 2001, the U.S. economy has grown at a sleepy 1.8% average annual rate—half the pace of average yearly growth from 1950 to 2000. During the same 13-year period, middle-class wages have declined.
Both parties have offered countless jobs proposals in the past five years. Democrats want to boost public investments. Republicans want to lower the corporate tax rate. Neither side has been willing to meet the other halfway. Simply put, bipartisanship has failed.
So let’s try partisanship.
What follows is a pair of partisan deals to create jobs and lift middle-class wages. Each party will broker one deal, in which it must fund its top priority with a source of savings it has already endorsed. In the end, the two halves will be put together to form a package that we estimate will create more than half a million jobs and allow each party to claim victory—without either party being subject to defeat. The contours look like this:
- Democrats get to boost spending on much neglected public investments by $400 billion over ten years. To finance investments, the party must identify equal savings in mandatory programs. That’s an intraparty deal Democrats can stomach, because they get to do it without touching benefit levels of social programs. Case in point: savings of that magnitude have appeared repeatedly in President Obama’s budget proposals.
- Republicans get to cut the woefully uncompetitive U.S. corporate tax rate by 4 percentage points. The GOP must finance the rate cut by reducing tax-code spending on wealthy individuals. It’s a doable deal within the party, because it doesn’t require raising any tax rate or increasing topline levels of taxes or spending. Case in point: the Republican Party’s 2012 presidential nominee put this deduction limit at the center of his tax agenda.
What follows is an argument for the necessity of such a deal, as well as greater detail on how each party could fulfill its side of the agreement.
The Problem: Low Investment and a Destructive Corporate Tax Code
Strong economic growth is necessary to create jobs and raise living standards, but robust growth has been painfully absent from the U.S. economy for 13 years.
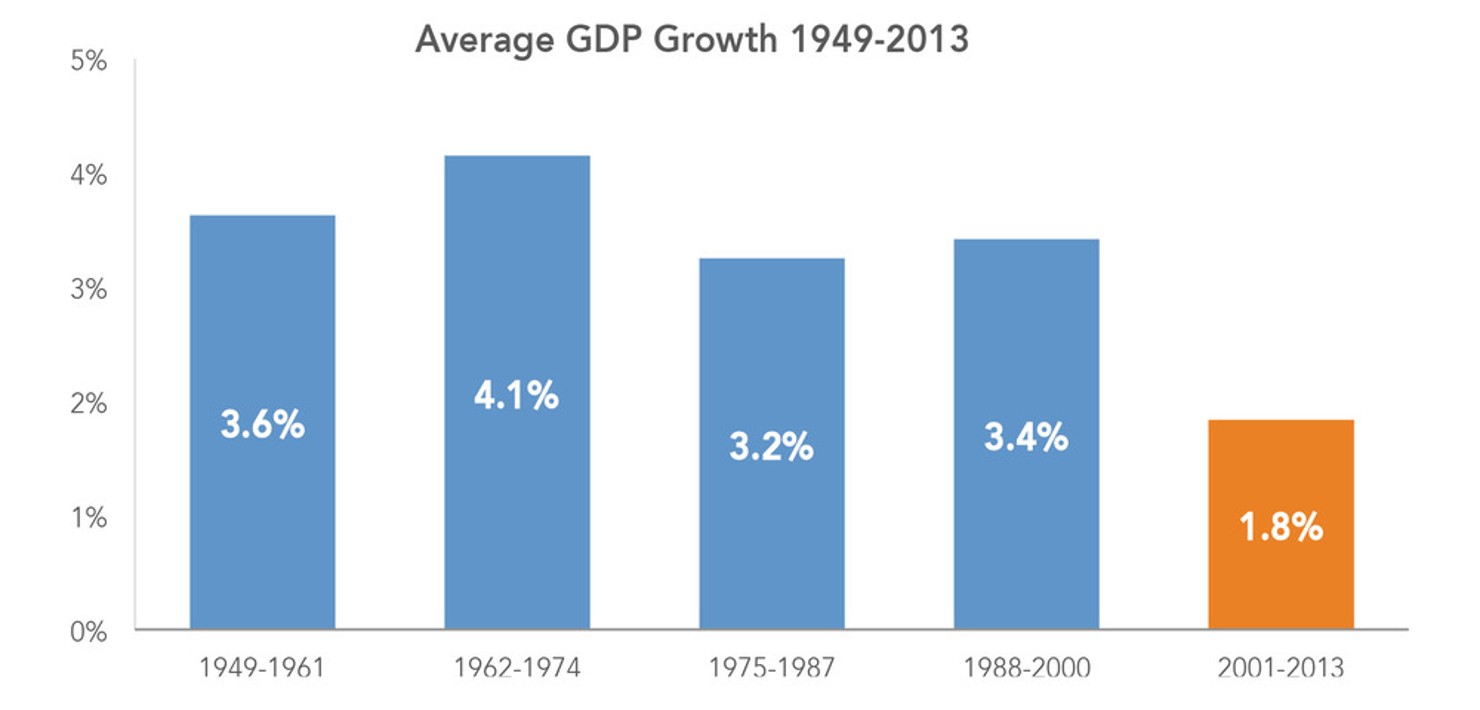
Source: Bureau of Economic Analysis, December 2013.
From 1950 to 2000, average annual GDP growth stood at 3.7%. That growth supported millions of new jobs, steady wage hikes, and the historic expansion of the middle-class. But from 2001 to 2013, growth was cut in half, averaging a lumbering 1.8%.1 Projections for the next decade are also poor. The Congressional Budget Office forecasts 2.5% annual growth from 2014 to 2024, and Pricewaterhouse Coopers projects 2.3%.2 Neither our recent growth performance nor our current projected growth can support strong job creation and wage growth for the middle class.
How Democrats See the Problem: Low Public Investment
Public investments—in infrastructure, research and education—enable growth by raising the productivity of businesses and workers. Federal investments from the 1950s through 1980s hovered around 5% of GDP, fueling strong economic growth. But by the last decade, federal investments had dropped to 3%, and growth followed suit.3
Abundant research suggests that boosting investments can elevate growth. First, multiple studies show that strong public investment is positively associated with productivity growth across OECD countries.4 Second, research shows that the United States, because of its relatively low level of public investments today, stands to benefit more than almost any developed country from a boost in public investment spending. If the United States were to increase its total public capital stock by $1.3 trillion (it is currently about $9 trillion), the economy would likely grow 2.3% larger over the course of 20 years. That would be a 30% rate of return.5
Evidence of poor public investment is not just macroeconomic; real examples are evident throughout the economy:
- A world-class infrastructure allows people, goods, and energy to move further, faster, and cheaper around the globe, but today we spend less on infrastructure than at any point in the last 20 years.
America has an infrastructure crisis as a result. About one fourth of our country’s bridges are either functionally obsolete or structurally deficient; aging wastewater systems result in sewer overflows and water contamination; roadway congestion drives up fuel consumption; East Coast ports sit unprepared for the larger ships that will soon traverse the expanded Panama Canal.6
- Publicly financed basic research provides the expanding knowledge base needed for new innovations in energy, medicine, technology, and transportation, but federal spending in the sciences has fallen from nearly 12% of the budget in 1964 to less than 4% today.7 Federal research and development spending has fallen by $24 billion since 2010, largely due to sequestration.8
The funding drought means young American scientists cannot get grants and either leave the profession or are lured abroad.9 Fewer scientific journal articles are published.10 Meanwhile, foreign competitors like China and Korea have significantly increased their public support for R&D.
- Public funding for education and workforce training has failed to keep pace with the demands of a knowledge economy.
American workers have reading, quantitative and technological skills that score mediocre to poor in international tests.11 The problem is more clearly seen at America’s community colleges, which educate 44% of students in higher education, yet have experienced heavy budget cuts in recent years.12 Students face increasing tuition and declining services, and most of them leave without earning a credential, entering the workforce without the human capital our economy needs.
Unfortunately, our declining commitment to investments is not a new phenomenon. Falling public investment exists at the federal, state, and local government levels. The trend can be traced to the 1960s and is projected to continue through the next decade. In the 1960s, federal spending on investments was 6% of GDP. As the government added new social programs, public investments fell in priority. Critical but expensive universal entitlements, mainly Social Security and Medicare, have put pressure on all other parts of the budget. With the continuation of sequestration, public investments are about 3.3%. Unless action is taken, that figure will fall to 2.3% within the next decade.13
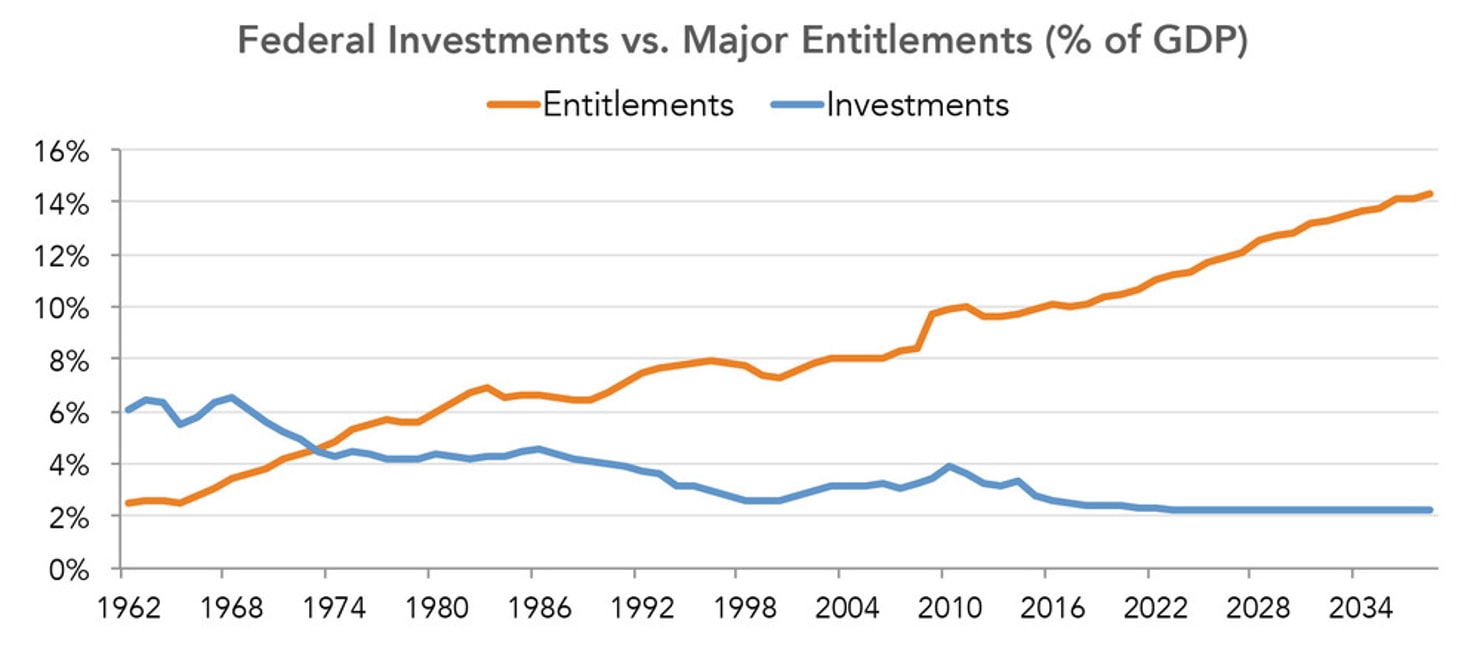
Source: “Collision Course,” Third Way, July 2012.
At the state and local levels, similar forces are at work. Rising retirement obligations and health care costs have rapidly increased spending on pensions and Medicaid. State and local infrastructure spending, however, makes up a smaller share of GDP than it did two decades ago. K-12 education spending has been flat, and higher education spending is up slightly, but not enough to meet economic needs.14
How Republicans See the Problem: An Uncompetitive Business Tax Code
While dwindling public investments are holding back the productivity of American businesses and workers, our business tax code is holding back their international competitiveness. The last time Congress reformed the business tax code was 1986. Since then, the world economy has become more interconnected, more digitized, and more competitive. Other countries took notice, streamlining their tax codes and lowering their rates to suit the modern era. Meanwhile, the U.S. code has only grown more cumbersome, taking on more specialized preferences and more complicated incentives.
Now, the primary problem is that the statutory corporate tax rate is too high. With a top federal rate of 35% and average combined state and federal rate of 39.2%, the United States claims the highest corporate tax rate in the developed world. Many point out that few companies pay an effective rate that high. And that is true, because of the numerous deductions, credits, and other special preferences companies can use to lower their bill. The Congressional Research Service reports that on average, companies pay more like 27.1%, which is still higher than the OECD average.15 Still, the high statutory rate matters greatly because it incentivizes businesses to make decisions based on reducing their tax liability, at the expense of factors related to business efficiency. American companies spend $40 billion per year complying with the code and attempting to reduce their payments. That’s more than 12% of corporate tax revenue and represents the enormous amount of waste generated by the code.
An improved business tax code would aid economic growth and job creation in several ways. Companies would seek to locate their production here, instead of abroad. Companies would seek to return and reinvest their foreign profits in America. And they would spend less resources complying with and gaming the tax code, allowing for greater business investment and innovation.
The Solution: Creating Jobs With New Investments and Business Tax Reform
Of the two growth problems laid out above, low public investment is of most concern to Democrats. Therefore, they should be responsible for identifying offsetting savings—within broad outlines Republicans would accept. Similarly, uncompetitive tax policy has topped the priority lists of many Republicans. So it’s the GOP that should carry the task of cutting offsetting spending elsewhere in the code, so long as the middle-class doesn’t pay the price. Here is the outline of a plan which could fulfill these terms:
The Democratic Deal: Reduce Mandatory Spending, and Dedicate Revenue to Investments
In our jobs plan, if Democrats are to free up the resources to fund the new investments they rightly argue for, they must find savings in mandatory programs. To make mandatory savings palatable for Democrats, no spending cuts would come from beneficiaries and every mandatory dollar saved would be a dollar invested in education, research, infrastructure, or any domestic program deemed an investment under the OMB definition. We propose several areas for Democrats to consider for mandatory savings, which together would generate $400 billion in savings over ten years.
New spending under this plan can be directed to public investments through a variety of channels. First, we propose that the Congressional Budget Office certify each year the amount of savings generated by the mandatory spending reforms above. Then, that sum would be made available to appropriators to spend on eligible public investments. That sum would not be subject to spending caps or sequestration under the Budget Control Act. A special savings account, similar to the Violent Crime Reduction Trust Fund created in 1994, could be used to ensure all of the savings go strictly to new public investments.16
There are many reasonable sources of savings Democrats may identify to generate $400 billion in new investment spending. Table 1 identifies possible sources, but Congress has already identified additional options, including those in the Unified Savings and Accountability Act of 2014. Sponsored by Reps. Mike Coffman (R-CO) and Kyrsten Sinema (D-AZ), the bill would save nearly $200 billion from sources ranging from federal contracting reform to federal IT efficiencies.17
Table 1: Mandatory and Discretionary Spending Reforms
Policy | 10-year cost |
Medicare payment reforms: Policies that move Medicare from fee-for-service toward quality-based payments would reduce waste and save billions. Examples include implementation of medical homes and bundled payments. | -$330 billion |
Reform agriculture subsidies: The Federal Crop Insurance Program has ample room for savings through changing premiums and limiting reimbursements to insurance companies, among other reforms. | -$30 billion |
Reduce Fannie Mae and Freddie Mac (GSE) subsidies: Guarantee fees the GSEs assess on loans can be increased, and limits on the size of a loan the GSEs could include in mortgage-backed securities could be slowly reduced. | -$20 billion |
Other mandatory savings: Examples include reducing the size of the strategic petroleum reserve, reforms to the Tennessee Valley Authority, and adjustments to loan subsidies for graduate students.18 | -$20 billion |
Increase federal investments: Appropriate funds in excess of spending caps to qualified jobs-focused investments in research, education, and infrastructure. | +$400 billion |
Total | $0 |
Eligible public investments should include important priorities in the areas of education, research, and infrastructure. The following options, among others not listed, have a clear, direct link to job creation:
- Financing a public-private infrastructure bank.
- Expanding construction of ports and waterways via the U.S. Army Corps of Engineers.
- Scaling up our renewable energy infrastructure.
- Increasing the federal agency accounts that provide research grants, such as the National Science Foundation, the National Institutes of Health, the Defense Advanced Research Projects Agency, the Department of Energy’s Office of Science, NASA, and others.
- Scaling up successful workforce training programs.
- Increasing federal grants to community colleges with innovative programs and proven results.
- Expanding programs that promote and support apprenticeships.
- Expanding and building new federal manufacturing institutes.
Devoting an additional $40 billion a year over the next 10 years to public investments would elevate the level of employment by an estimated 320,000 jobs.19 Furthermore, the boost to long-term growth created by prudent investments would elevate employment to an even greater extent.
The Republican Deal: Limit Tax Spending on Wealthy Individuals to Cut Business Tax Rates
If Republicans are to meaningfully reduce the corporate tax rate, they must find extra revenue from some significant source in addition to closing loopholes on the business end. In our plan, we break the firewall between the individual and corporate codes—a firewall that filers have been breaching for decades.
Under our jobs plan, we borrow an idea from former Republican presidential nominee Mitt Romney and put a $50,000 cap on itemized deductions (exempting charitable deductions) for those with more than $250,000 in income. Under this rule, a family with income over the threshold could deduct no more than a total of $50,000 for expenses such as state and local taxes, real estate taxes, mortgage interest, and medical expenses. This would raise approximately $400 billion from only 1.9% of taxpayers.20
Republicans in addition to Governor Romney have lamented the amount of waste in the individual code. But they are loath to adopt any reform that increases overall taxation. To make this deduction cap palatable to Republicans, we devote these savings to another Republican priority: lowering the corporate tax rate. Thus, this would trade excess tax expenditures gleaned by the wealthy for an investment in competitiveness by reducing the corporate tax rate by 4 percentage points.
Democrats have recognized the dilemma posed by our world-highest corporate tax rate, but some of them view a reduction of the rate as a giveaway to the powerful interests. However, financing a corporate rate reduction strictly through new revenue from high-income individuals would be a different approach. It is not only sound economics, but also progressive policy. In a world of increasingly mobile capital, taxing income at the corporate entity level is increasingly elusive. Multinational corporations easily locate income in the country of their choice; entities are easily sold internationally or moved across borders. But, individuals will less easily abandon their United States residency on account of a limit to itemized deductions. Plus, the burden of the corporation tax, economists agree, is shared in part by workers. Taxes on wealthy individuals are born by wealthy individuals.
Capping individual tax expenditures could finance a corporate rate reduction of four percentage points, to 31%. That would provide a meaningful improvement to our tax competitiveness. Our revenue-neutral plan would mean U.S.-based companies would face less of a penalty for repatriating foreign profits, and they would have more dollars to invest and hire. Importantly, the rate cut would benefit businesses and workers across all sectors.
Table 2: Tax Policy Reforms
Policy | 10-year cost |
Cap itemized deductions at $50,000: Individual tax filers with AGI greater than $200,000 ($250,000 for married couples) would be able to claim no more than $50,000 in itemized deductions. Charitable contributions would be excluded, and there would be a phase-in to avoid a tax cliff.21 | -$400 billion |
Reduce corporate tax rate from 35% to 31%: This would allow future revenue-neutral tax reform to further reduce the rate to 25%, which many policymakers have stated as their goal. | +$400 billion |
Total | $0 |
A straight 4 percentage point cut in the corporate tax rate would elevate the level of employment by an estimated 190,000 jobs.22 This policy would also provide a significant boost to business tax reform, which has stalled because of a conventional wisdom accepted by members of both parties: that any corporate rate reductions must be fully paid for by removing corporate tax preferences. Leading Republicans, many Democrats, and major corporations agree that a 25% rate should be the target for reform. But getting to a 25% rate solely through base-broadening is virtually impossible. Starting from 31%, instead of from 35%, would make the goal attainable.
Conclusion
There are still too few jobs that support a middle-class life. The U.S. economy and the American middle-class desperately need policies that create good middle-class jobs. Economists and policymakers agree that new public investments and a more competitive business tax code would generate those jobs. All that has stood in the way is bipartisanship in Congress, which has ranged from unproductive to nonexistent.
Congress can break the gridlock by taking a new, partisan approach. Republicans should accept the Democratic goal of funding robust new public investments, as long Democrats do the work to find commensurate savings from mandatory programs (that leave beneficiaries alone). Democrats should accept the Republican goal of a lower corporate tax rate, as long Republicans work to finance the cut progressively—by crafting a limit on tax spending for the wealthy.
The deal would immediately improve America’s economic outlook. A lower corporate tax rate would spur private investment. New spending on roads, bridges, workforce training, and scientific research would put people to work and raise productivity. And Congress will have proven that it can once again pass legislation that helps grow the economy.