Blog Published June 18, 2020 · 3 minute read
Transportation Emissions Keep Rising
Andres Prieto & Emily Mangan

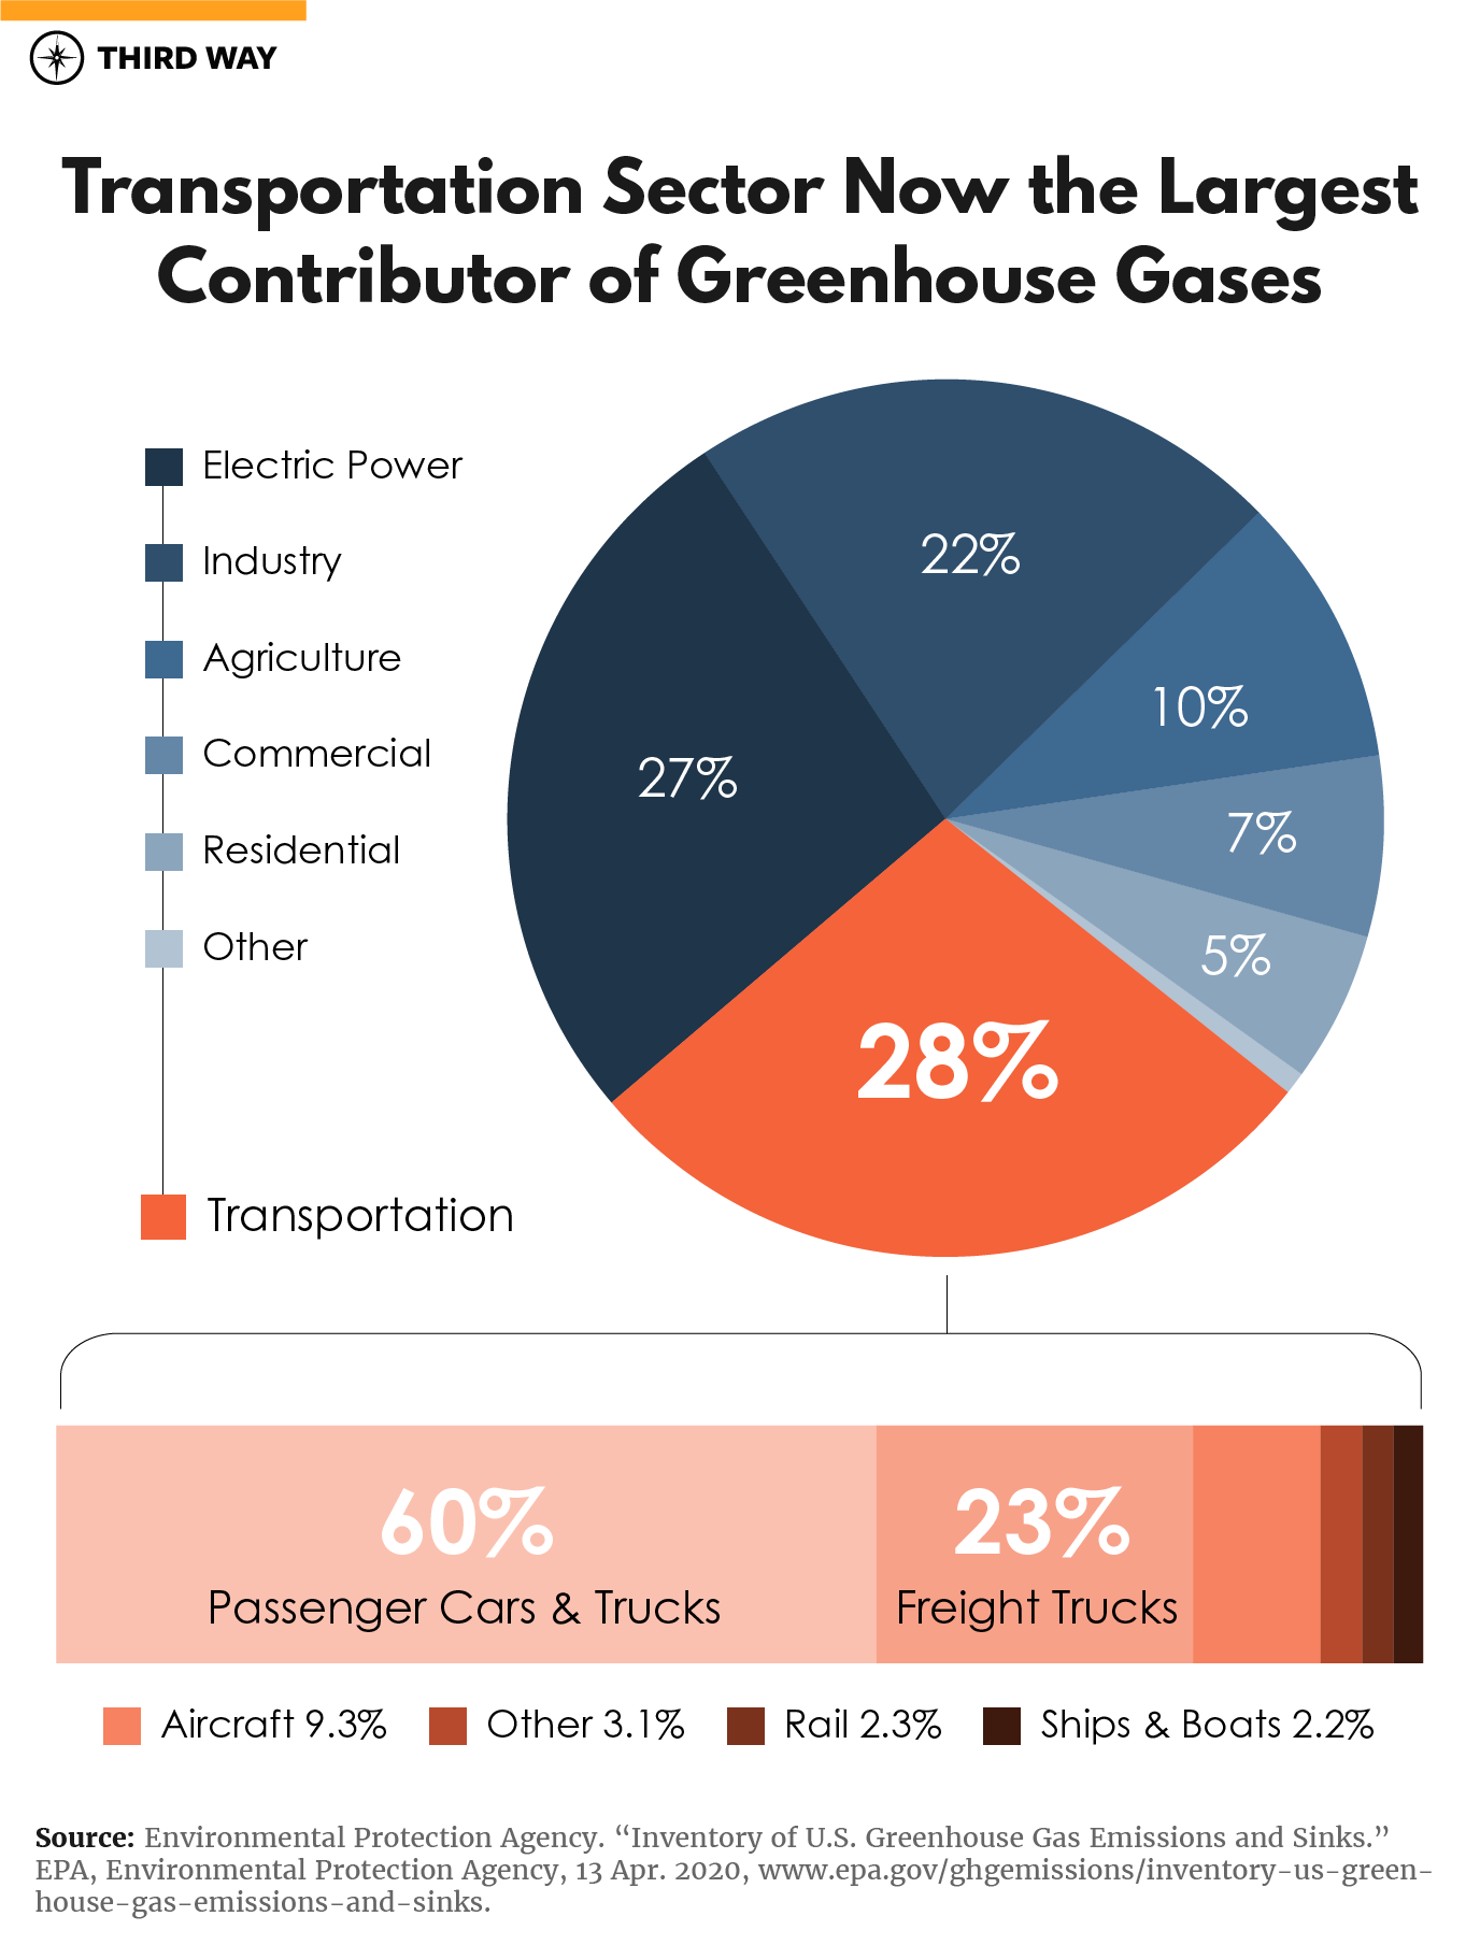
Transportation emissions continue to rise in the United States. While COVID-19 has upended daily life and temporarily disrupted this trend, years of data paint a clear picture. Transportation has now become the nation’s single largest source of greenhouse gases (GHG), accounting for 29 percent of total emissions, and 83 percent of those emissions come from cars and trucks. Scientists have been warning that we need to reach net zero emissions by midcentury to avoid the worst impacts of climate change, and this will mean significant emissions reductions across all sectors of the economy, including transportation. While other sectors of the economy have reduced emissions, transportation is headed in the wrong direction. But why?
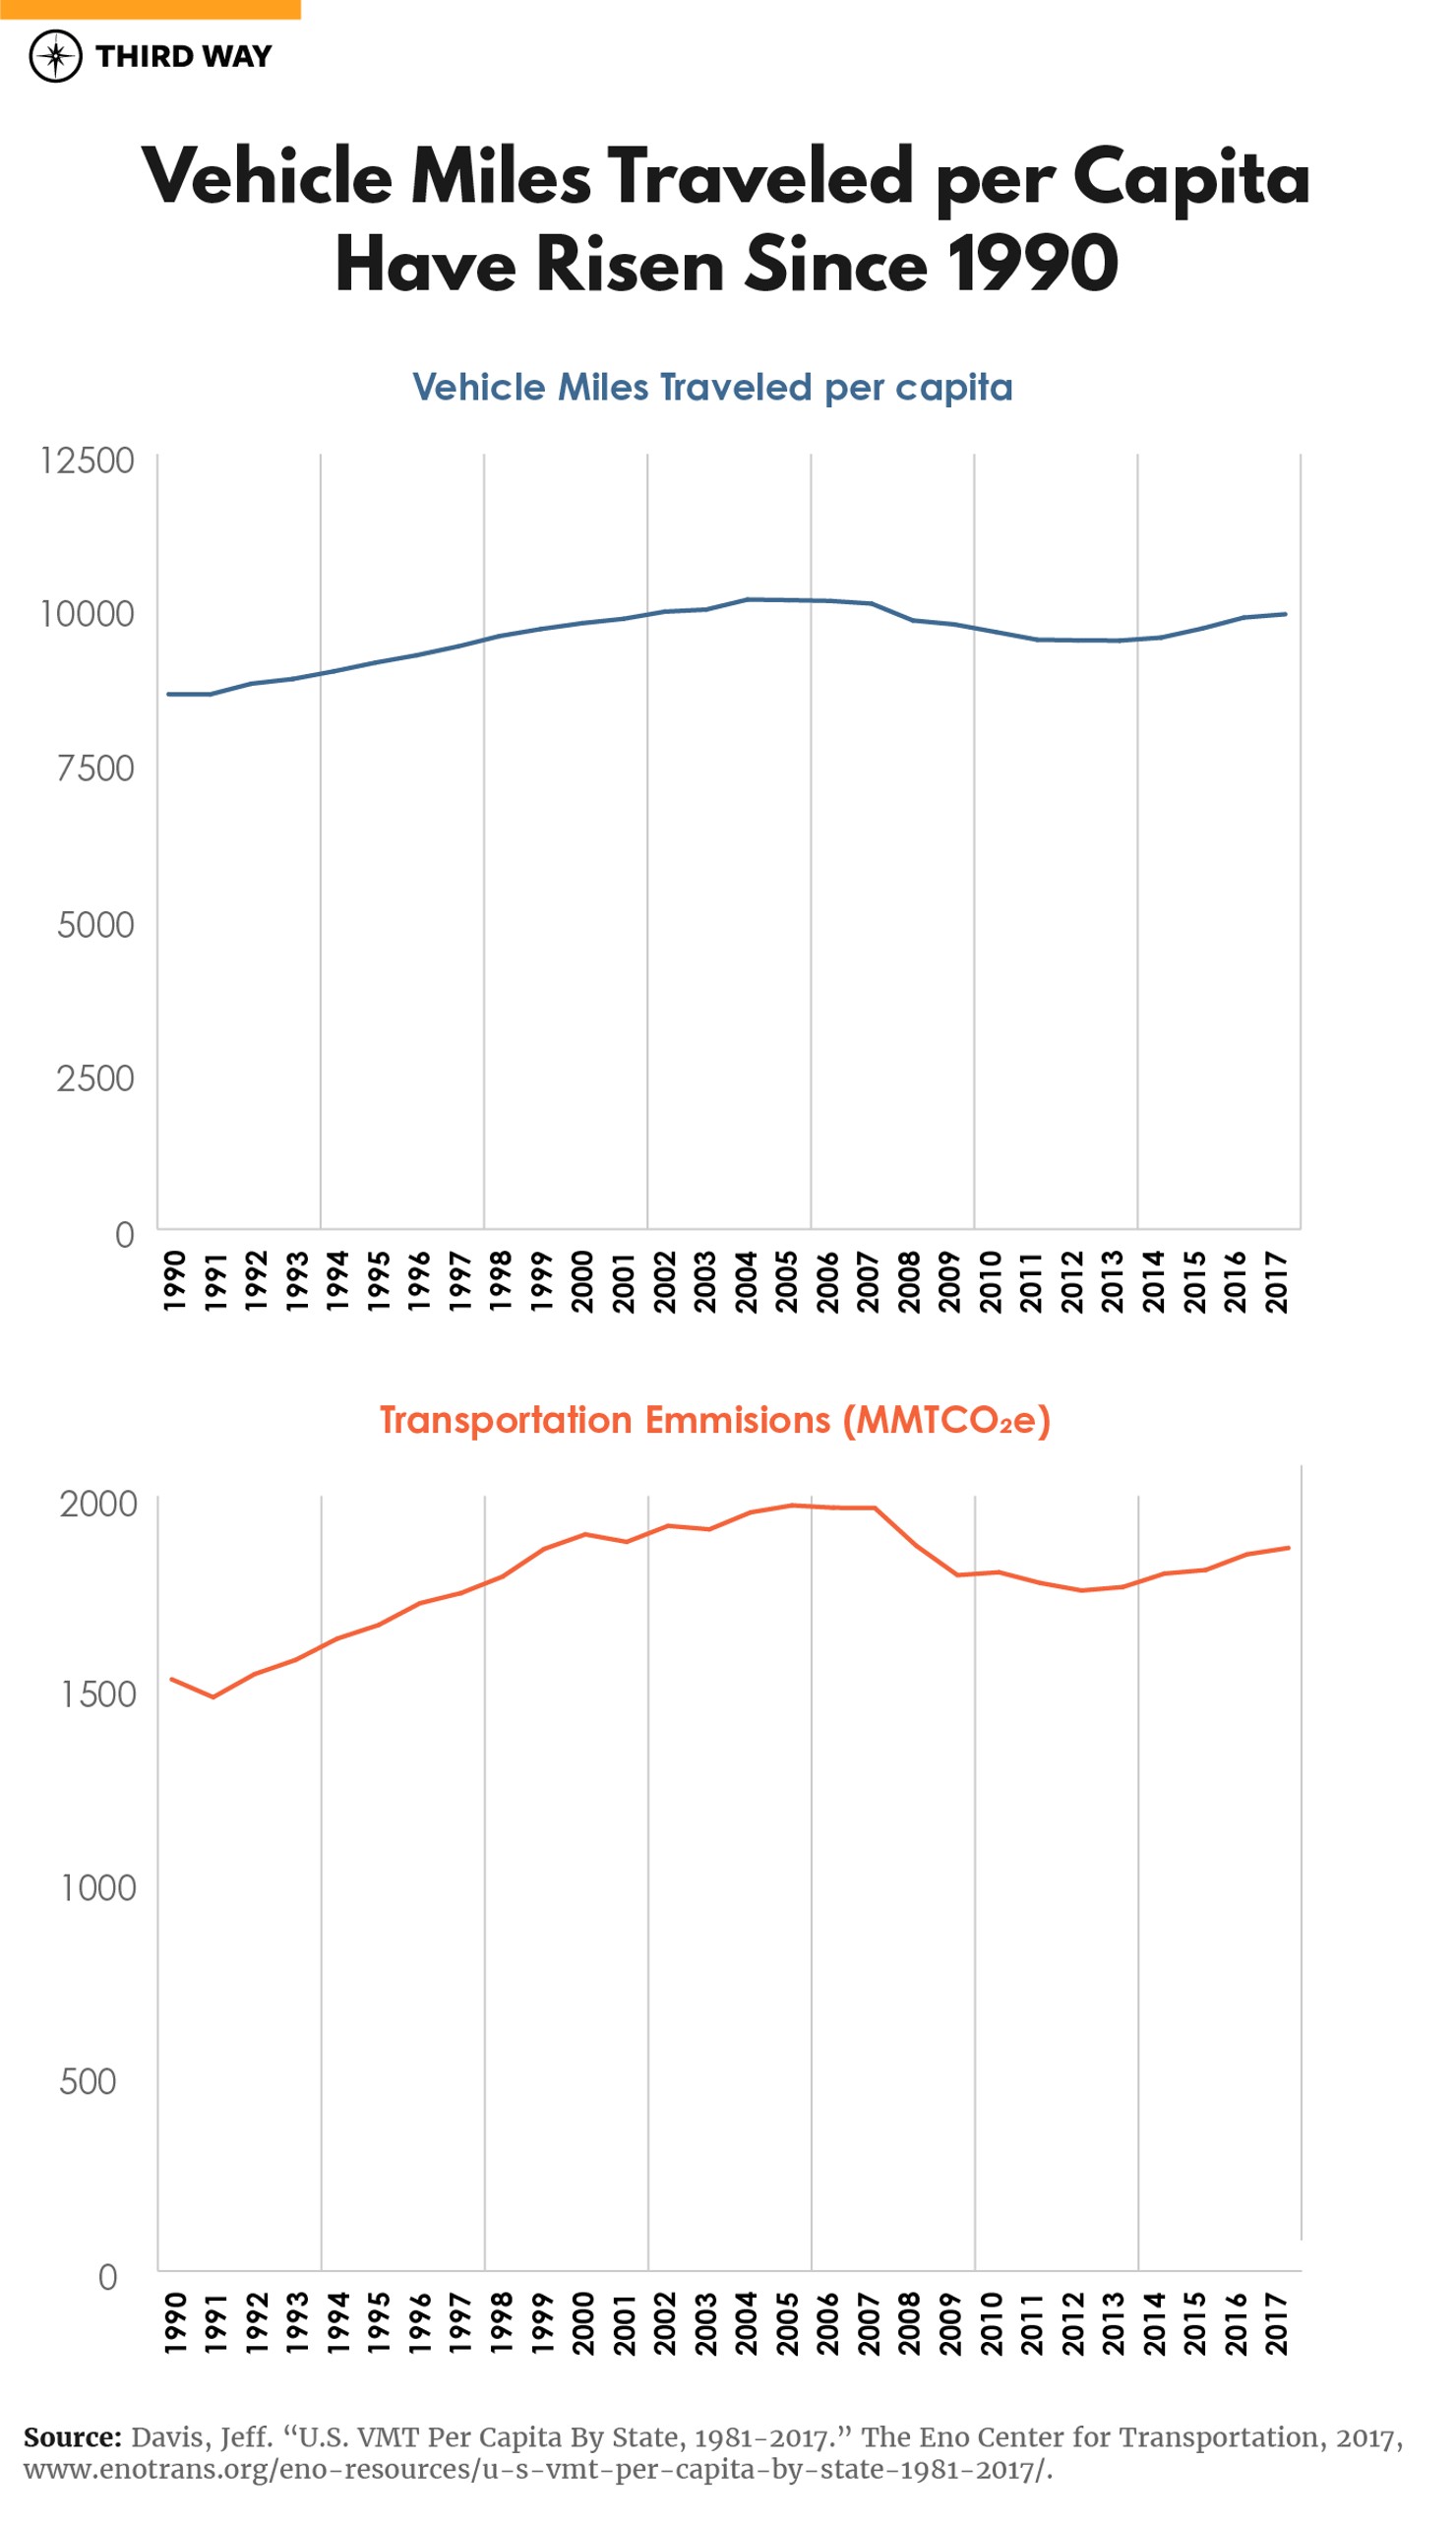
One reason is that Americans are driving more and more every year. From 1990 - 2017, total vehicle miles traveled (VMT) increased by 50%.1 VMT has risen both in aggregate terms, and when adjusted for population growth. Those cumulative additional miles on the road increased emissions year after year.
Vehicles Miles Traveled (VMT) per capita is one of the important drivers of greenhouse gas emissions in the U.S. but many people don’t even know what it means. VMT is simply the distance people drive, and VMT per capita is a number that expresses how many miles the average person drives in a year.
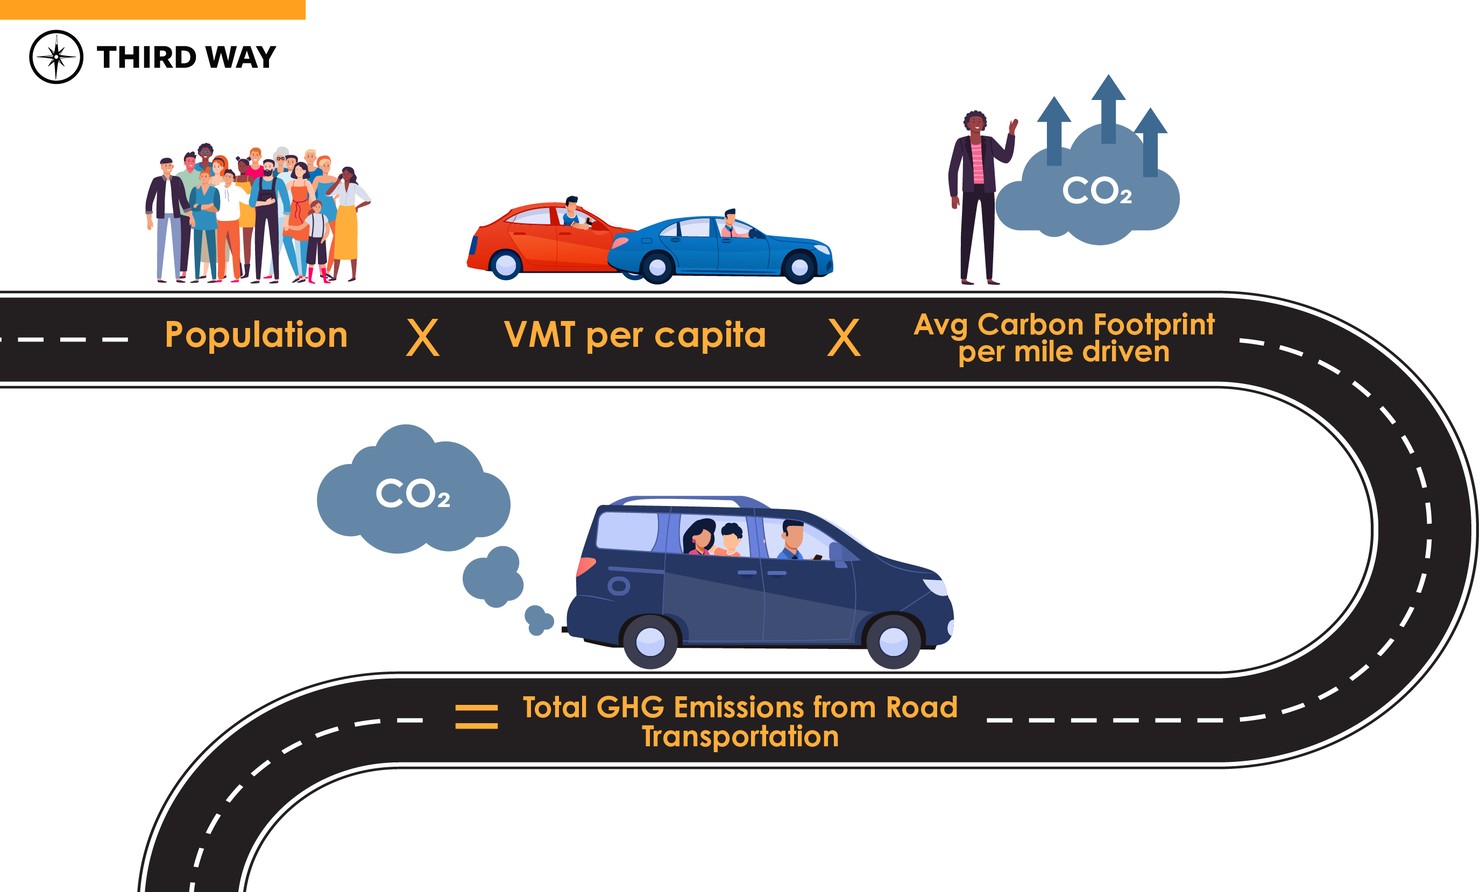
The growing trends in VMT are worrisome for two reasons 1) we are seeing growing emissions from driving 2) the average American is driving more, leading to more congestion and more time spent on the road. Ambitious electrification of vehicles could at least help address the first problem, but rates of fleet turnover and EV adoption have historically been much too slow to effectively decouple driving with emissions.
Because of this, changes in VMT per capita have dramatic effects on the carbon footprint of the transportation sector. In the U.S., driving results in about 24% of all our emissions. Of course, this includes not only vehicles driven from passenger cars but also the heavy-duty vehicles which often transport cargo. All together, the emissions from miles driven by all light and heavy-duty vehicles totals more than the emissions from the entire industrial sector.
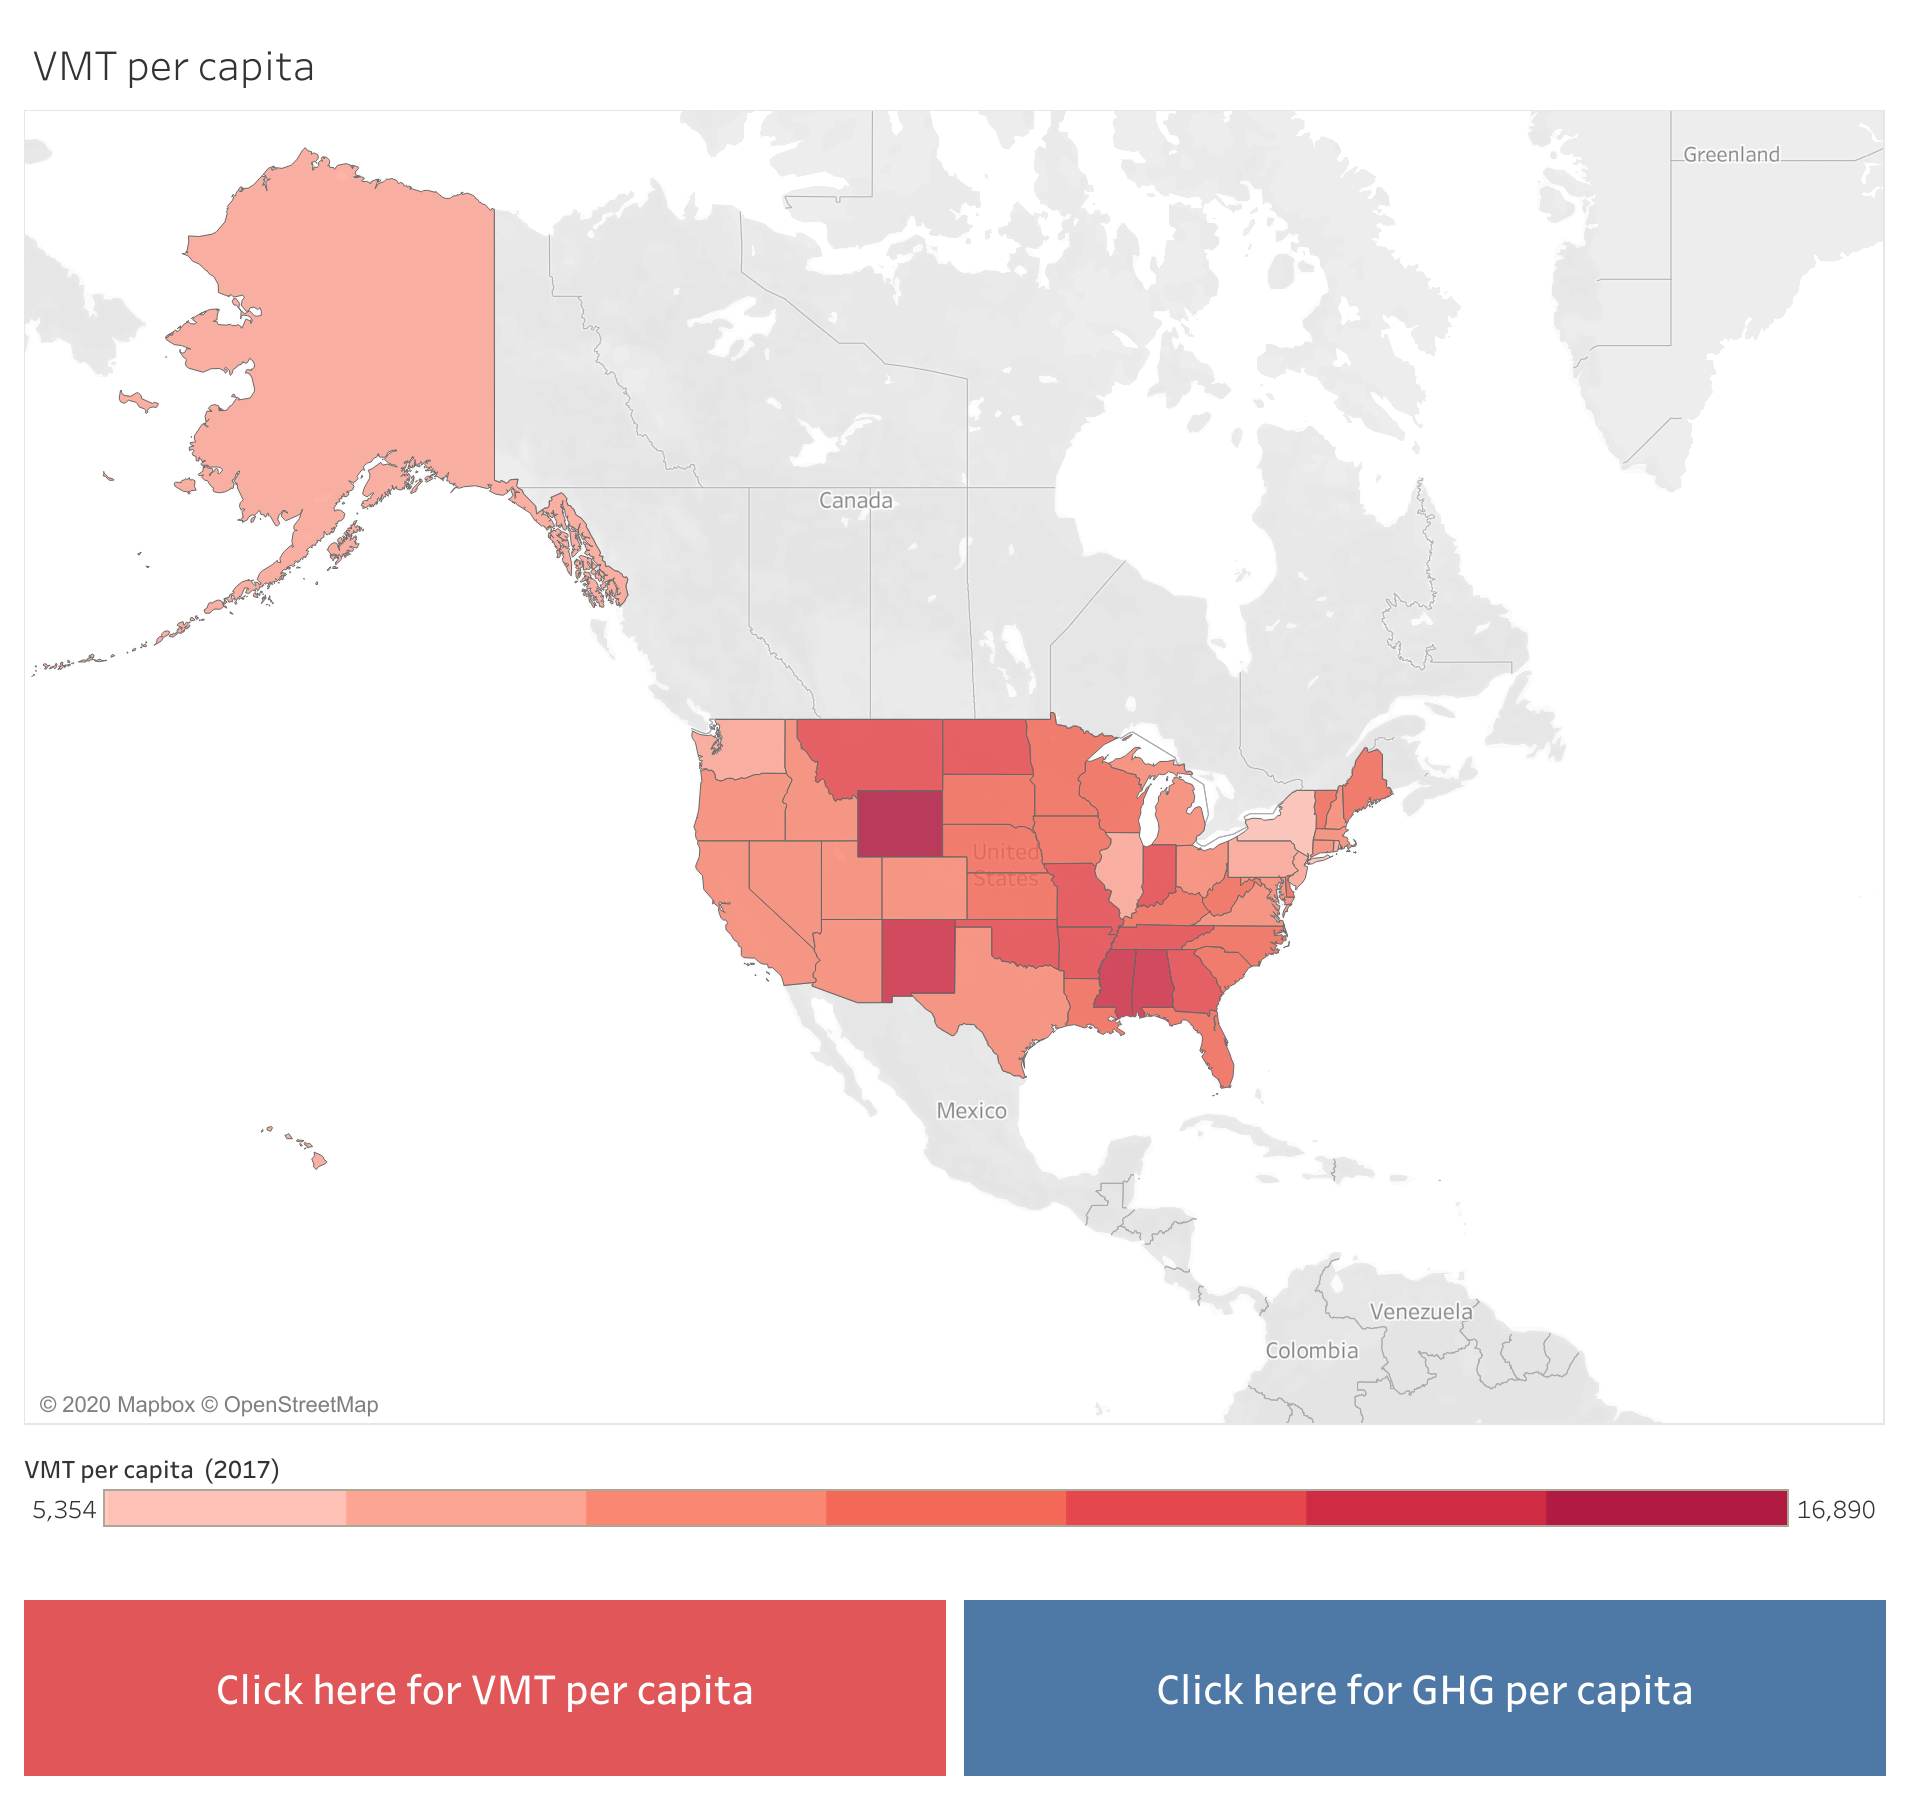
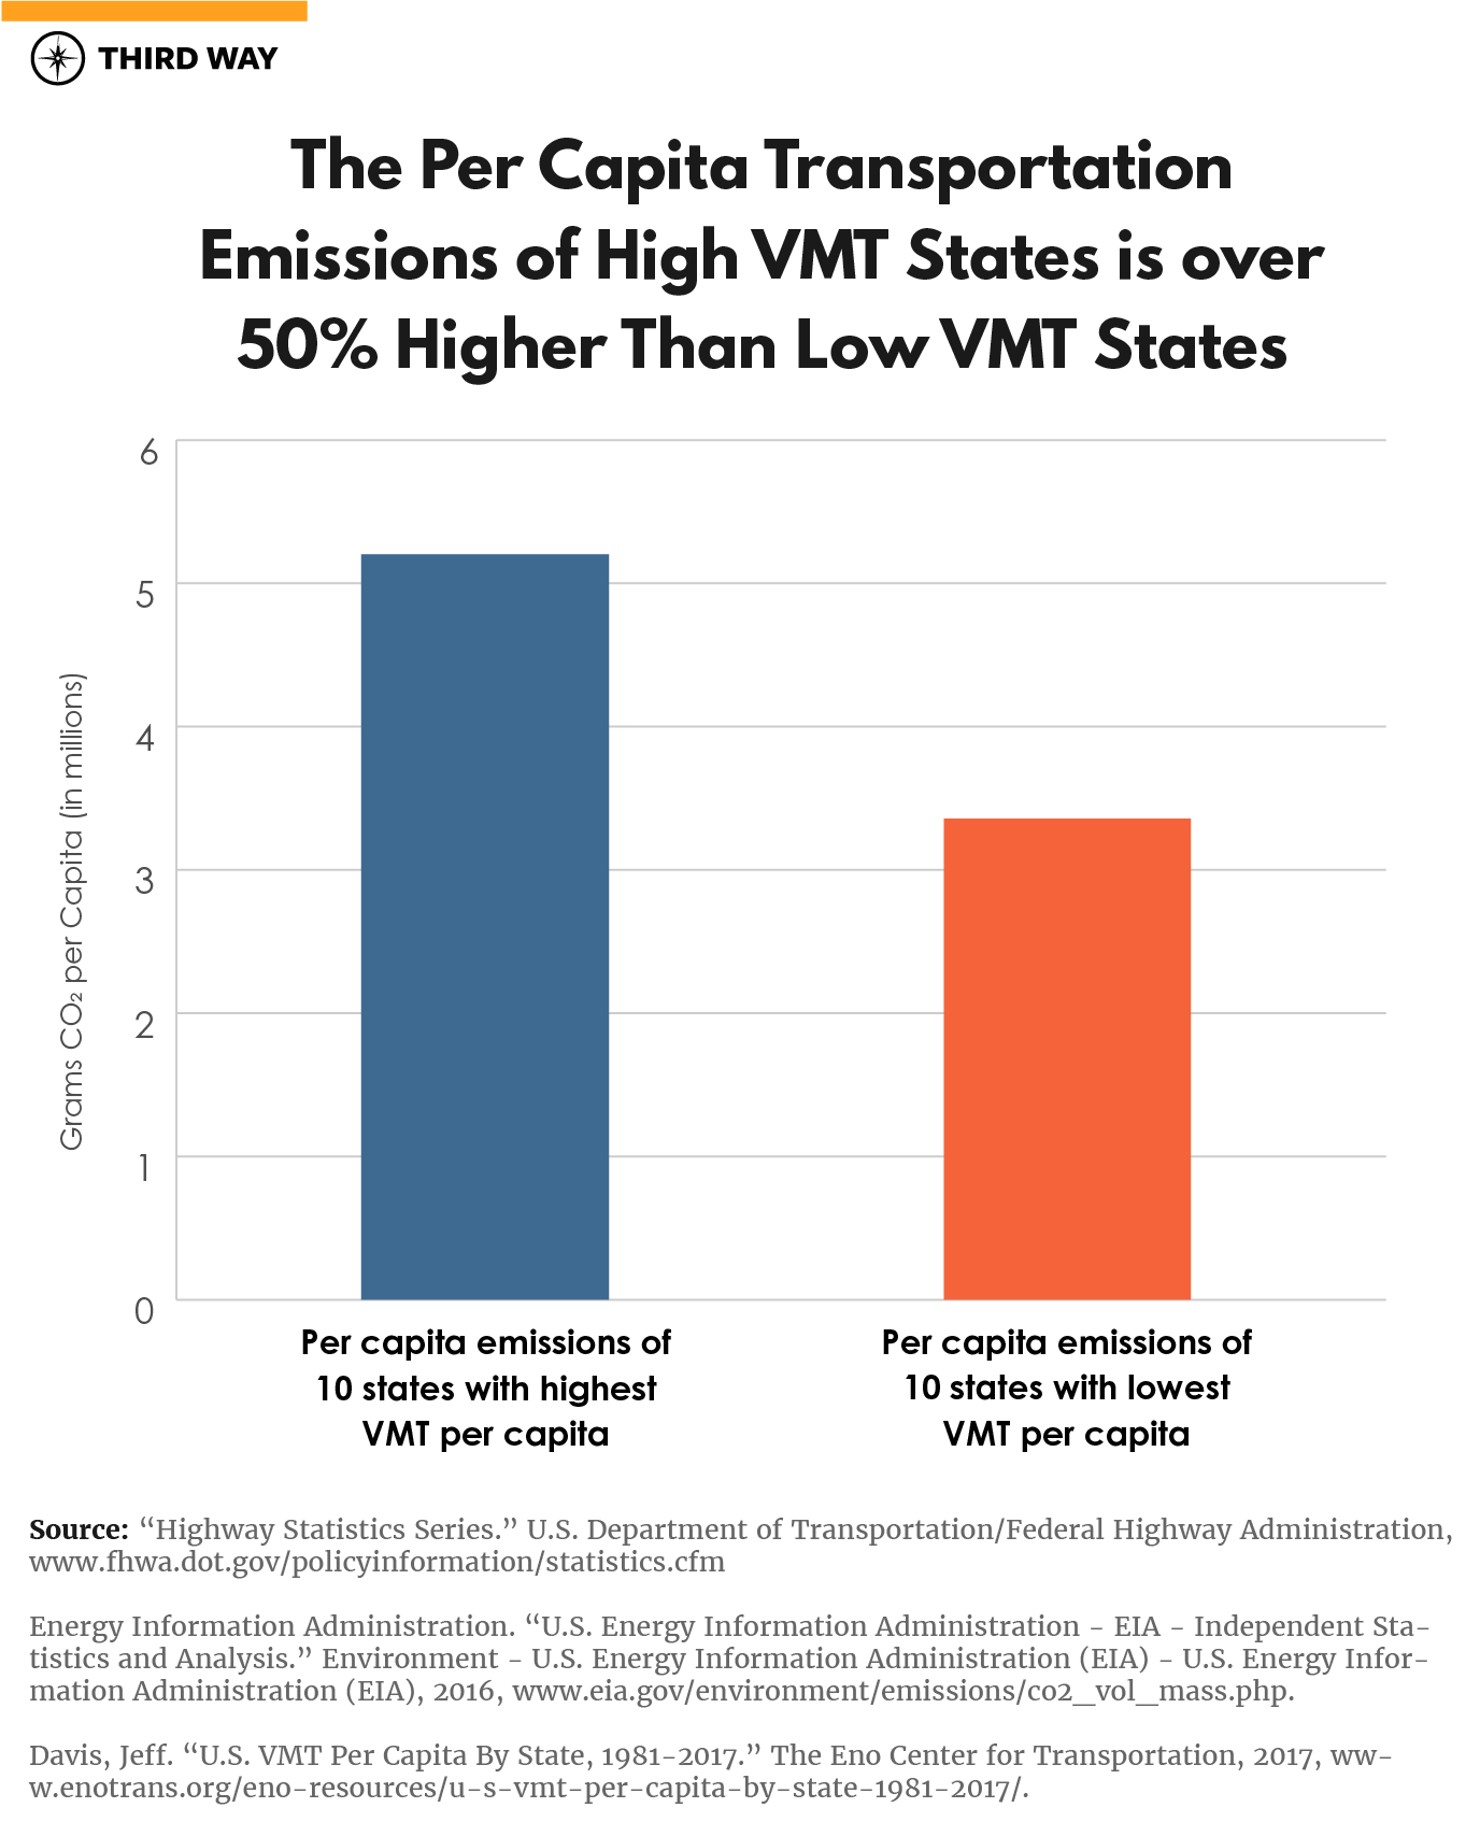
Clearly, increased levels of driving are leading to increased emissions. But not all states are driving as much. States where Americans drive the most—like Wyoming, Mississippi or New Mexico—have nearly twice the carbon footprint per capita than states that drive the least, like New York, Alaska and Rhode Island.
Taken together, it becomes more apparent that states with the highest VMT per capita are also producing significantly greater emissions per person. The chart below shows per capita emissions for the ten states with the highest VMT per capita, and the ten with the lowest.
High VMT rates are not necessarily limited to a number of inland states. There is a tremendous variation of VMT even within regions, and states with very high VMT rates are not necessarily the states you would expect. In the coming weeks, we will be writing more about the importance of VMT for climate and what factors might cause states to have higher VMT. In the meantime, take a look at your state’s VMT per capita and transportation emissions per capita in this map we made.