The Battle for the House: Independent Registration in Swing Districts
The center will be key in most toss-up districts. In the 2006 wave election, Democrats won Independents by 18 points—and took the majority in the U.S. House of Representatives after 12 years of Republican control.1 In the 2010 wave election, Republicans won Independents by 19 points—and wrested the majority back from the Democrats.2 In the past several years, Independents have increased across the U.S.—measured both by voter registration and surveys of the public. Combine their growing number with their recent volatility in House elections, and it is nearly guaranteed that Independents will play a major role in the battle for the House this November.
But just how important are Independents in the key battleground districts? Of the 435 U.S. House districts, 26 are considered a toss-up by one of the major ratings agencies this year.3 Of those 26 districts, 17 have voter registration data available by party identification and Congressional District. In these swingiest of swing districts, we present three findings:
- Independents make up nearly 30% of the electorate.
- Compared to statewide numbers and presidential battlegrounds, toss-up districts boast more Independents.
- Neither party is likely to win in these districts without appealing to Independent voters.
In battleground districts, Independents make up nearly 30% of the electorate.
In the 17 House districts listed as toss-ups where voter registration data is available by party, neither the Democrats nor the Republicans have a majority in voter registration.4 In fact, on average, each party boasts only about a third of the voters in these districts, and there are only a handful in which one party even reaches up to the low forties. Why? Because on average, 29.3% of the voters in these districts are registered as Independents.
In 4 districts—Arizona 1, Colorado 6, New York 18, and North Carolina 7—Democrats are a plurality of registered voters. That is, in 4 House battlegrounds, Democratic registration outnumbers Republican and Independent registration. In 8 districts—California 7, California 52, Florida 18, Iowa 3, Nevada 3, New York 19, New York 21, New York 27—Republicans are a plurality of registered voters. In 5 districts—Colorado 6, Massachusetts 6, New Hampshire 1, New Hampshire 2, Rhode Island 1—Independents are a plurality of registered voters, outnumbering adherents to both parties. In one instance, Massachusetts’ 6th Congressional District, Independents actually comprise a majority of voters.

On average in these 17 House battlegrounds, Democratic and Republican voter registration is nearly evenly split, with 35% for the former and 32% for the latter. But Independents compose nearly 3 in 10 registered voters in these districts, and thus they can tip the balance in these races come November.
Compared to statewide numbers and presidential battlegrounds, toss-up districts boast more Independents.
Historically, Democrats have enjoyed a voter registration advantage over Republicans, and looking at the statewide numbers, they do so in the battleground districts’ states as well. On average, the Democratic share of the electorate is approximately 40% statewide, giving the party an eleven point advantage over Republicans. However, in the battleground districts, that lead dissipates—dwindling to just 2 points—and the percentage of Independent voters (as well as Republicans) rises. Since many of these districts are in reliably blue states, such as California and New York, it is not surprising that the battleground districts shade more purple than statewide voter registration. Other states, such as Nevada, New Hampshire, and North Carolina, are already purple in the presidential race, and in those states the battleground districts predictably trend much closer to the state totals.
Compared to statewide voter registration, Democrats comprise a higher percentage of registered voters in only 4 districts—Arizona 1, Colorado 6, Iowa 3, and Rhode Island 1. In 11 districts—California 7, California 26, California 52, Florida 18, Massachusetts 6, Nevada 3, New York 18, New York 19, New York 21, New York 27, and North Carolina 7—Democrats comprise a smaller share of registered voters than they do statewide. In 2 districts—New Hampshire 1 and 2—Democrats comprise approximately the same percentage of registered voters as they do statewide.
Republicans, conversely, are over-represented in 13 districts as compared with statewide voter registration numbers. And Independents comprise a greater share of registered voters in 6 districts—California 52, Massachusetts 6, Nevada 3, New Hampshire 2, New York 18, and New York 19. While Independent enrollment statewide is closer to a quarter of the vote, these battleground districts harbor even more Independents (29.3%), along with fewer Democrats and more Republicans. This means the parties are nearly evenly matched and Independents will likely hold the keys to victory.
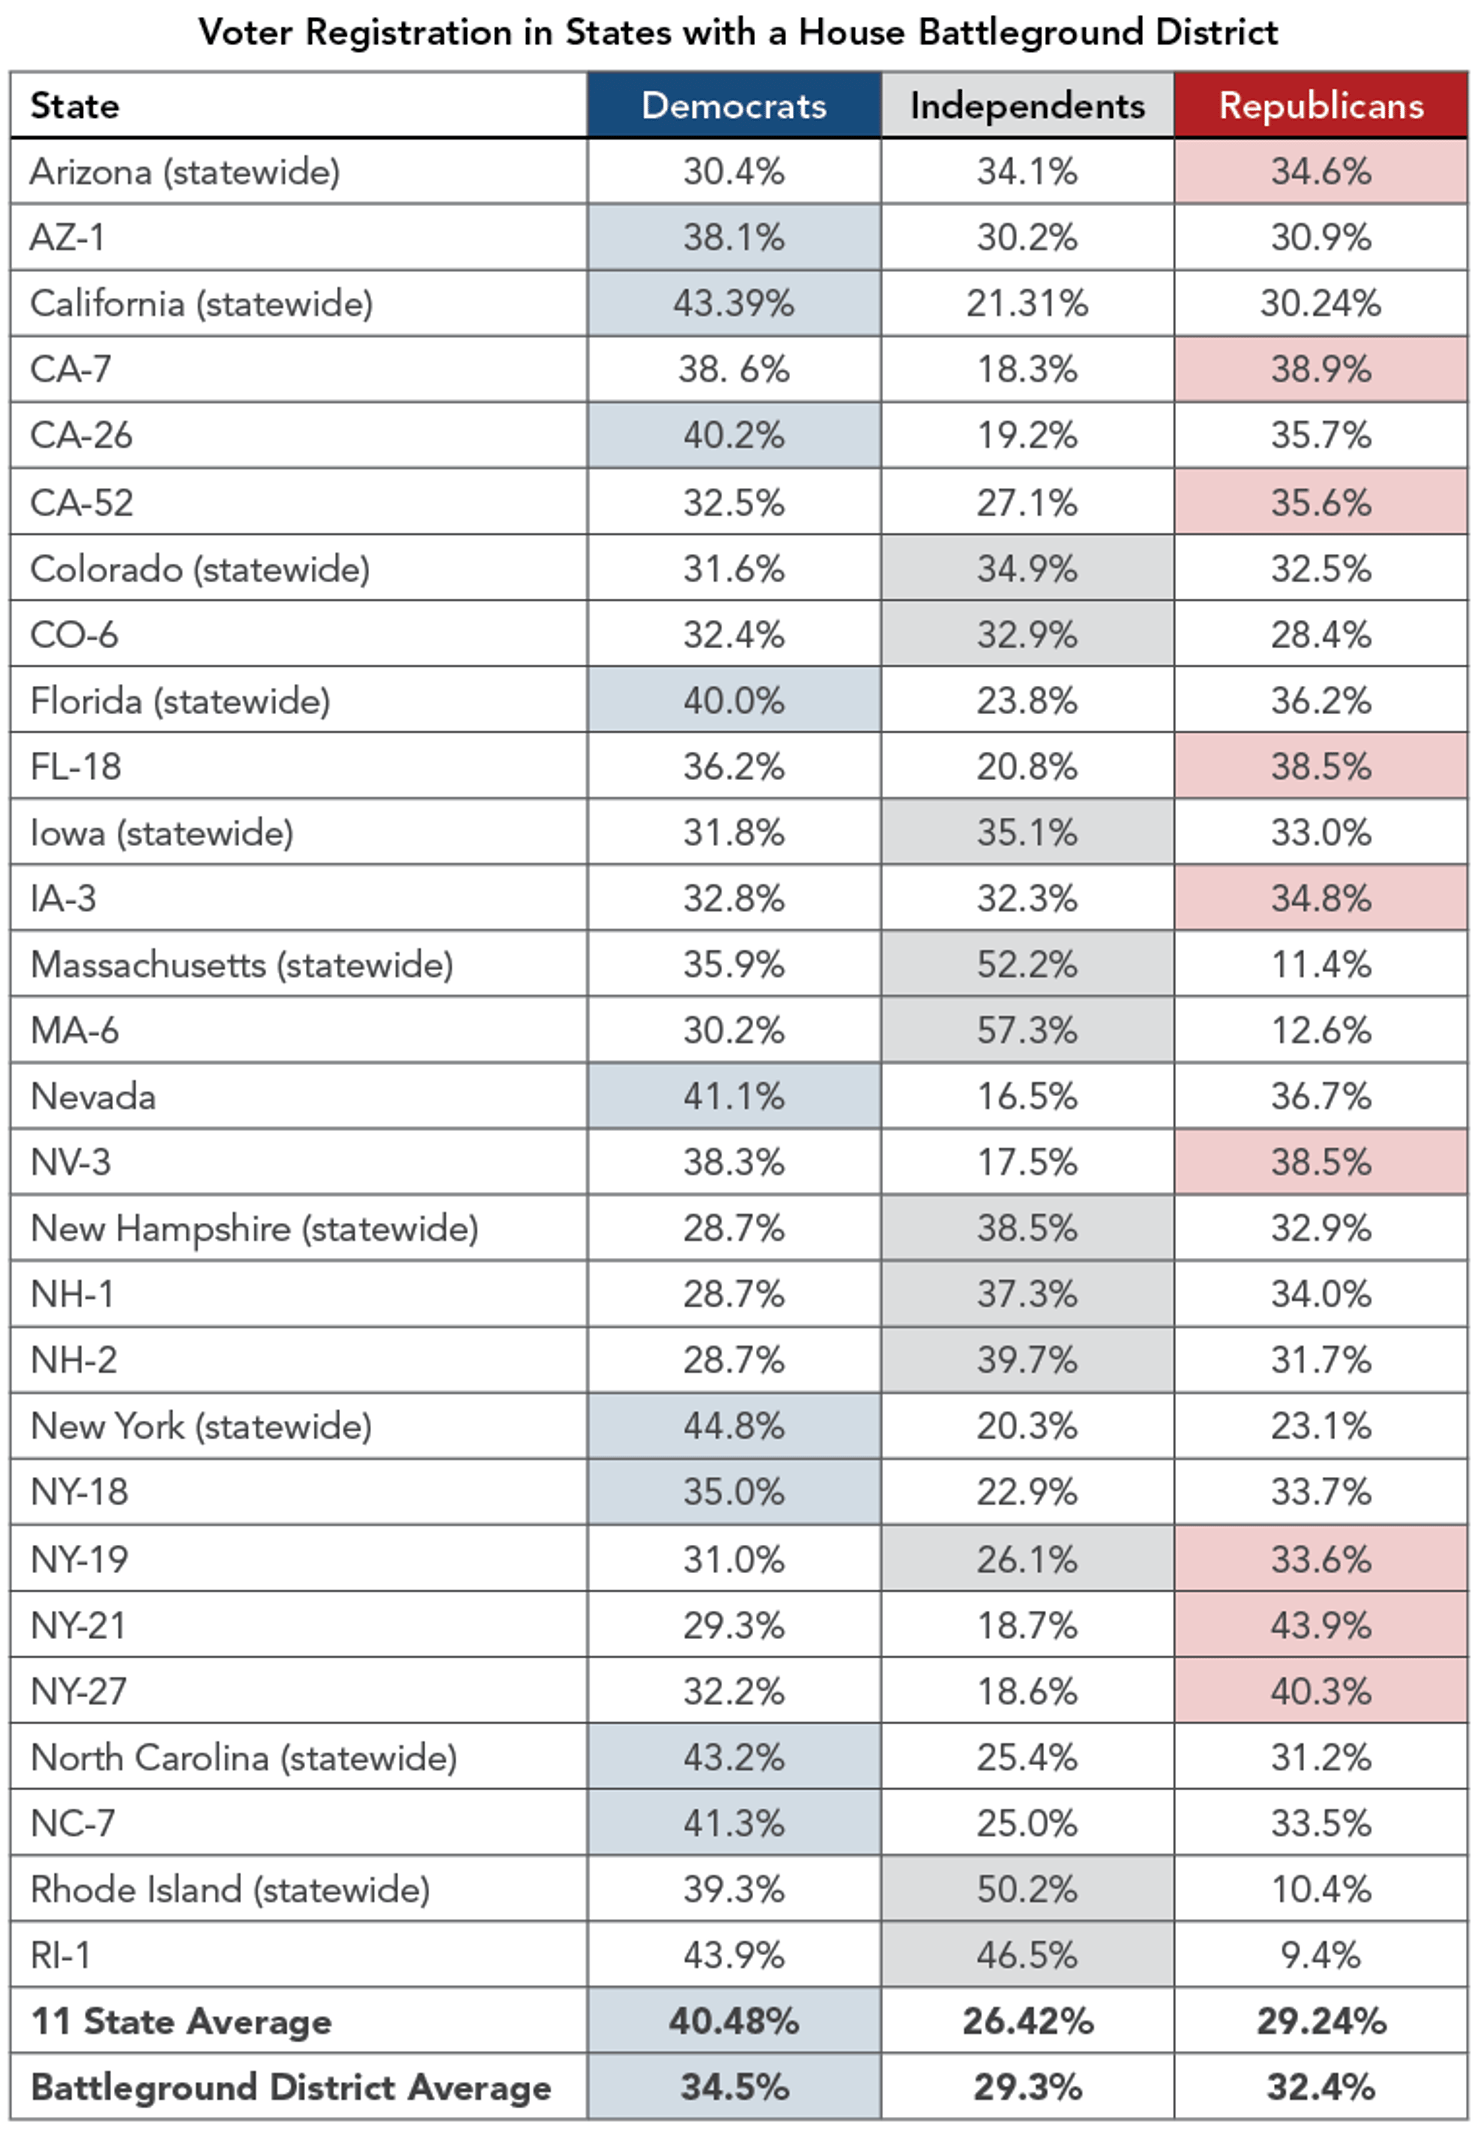
Since the big, blue states like California and New York may tilt the averages in the statewide numbers for the chart above, we also compared the registration in battleground districts to that in the presidential battleground states. We found that, on average, the House battlegrounds contain a significantly higher proportion of Independents even than the closely watched swing states—with Independents making up 29.3% of voters in the House battlegrounds and only 23.2% in the presidential.5

In the 8 presidential battlegrounds with partisan voter registration, 41.9% of voters are Democrats, 34.8% are Republicans, and 23.2% are Independents. However, in the House battleground districts, Democrats comprise only 34.5% of registered voters—7.4 points lower than the presidential states. There are slightly fewer Republicans in the House battlegrounds compared to the presidential battleground states. But the real trade-off for Democrats is with Independents, who comprise 6 points more of the electorate than in the presidential battlegrounds.
Whether compared to the composition of their own states or the presidential swing states, battleground House districts have a larger proportion of Independent voters and fewer registered Democrats.
Neither party is likely to win in these districts without appealing to Independent voters.
While each of the 17 toss-up districts has its own dynamics and specific characteristics, we can estimate the number of Independents both the Democratic and Republican candidates would need to win based on registration data.6 To do this, we assumed that turnout in these districts would reflect the percentages of registered voters. Of course, voter registration is not a perfect proxy for the composition of the electorate on November 6. The proportion of Democrats, Republicans, and Independents who turn out to vote in a given Congressional District fluctuates from year to year. But rather than attempt to estimate that difference—very difficult to do given shifting dynamics between midterm and presidential years and the low level of exit polling data available by Congressional District—we used hard voter registration data to estimate the makeup of the November electorate.*
Since some districts keep voter registration on minor parties and others don’t, we simply added together the registered Democrats, Republicans, and Independents and used the total as the basis for what our hypothetical electorate would look like.
Further, we estimated how many Democrats and Republicans each candidate would win based on average performance—how much of the vote House candidates won from partisans—from the 2004–2010 elections. We used exit poll data for the House National Ballot to determine the percent of Democrats who voted for the Democratic candidate and the Republican candidate and the percent of Republicans who voted for the Republican and Democratic candidate. Thus, Democrats, on average, voted 91.5% of the time for the Democratic candidate and 7.5% of the time for the Republican candidate. Republicans, on average, voted 91.8% of the time for the Republican candidate and 7.3% of the time for the Democratic candidate.7
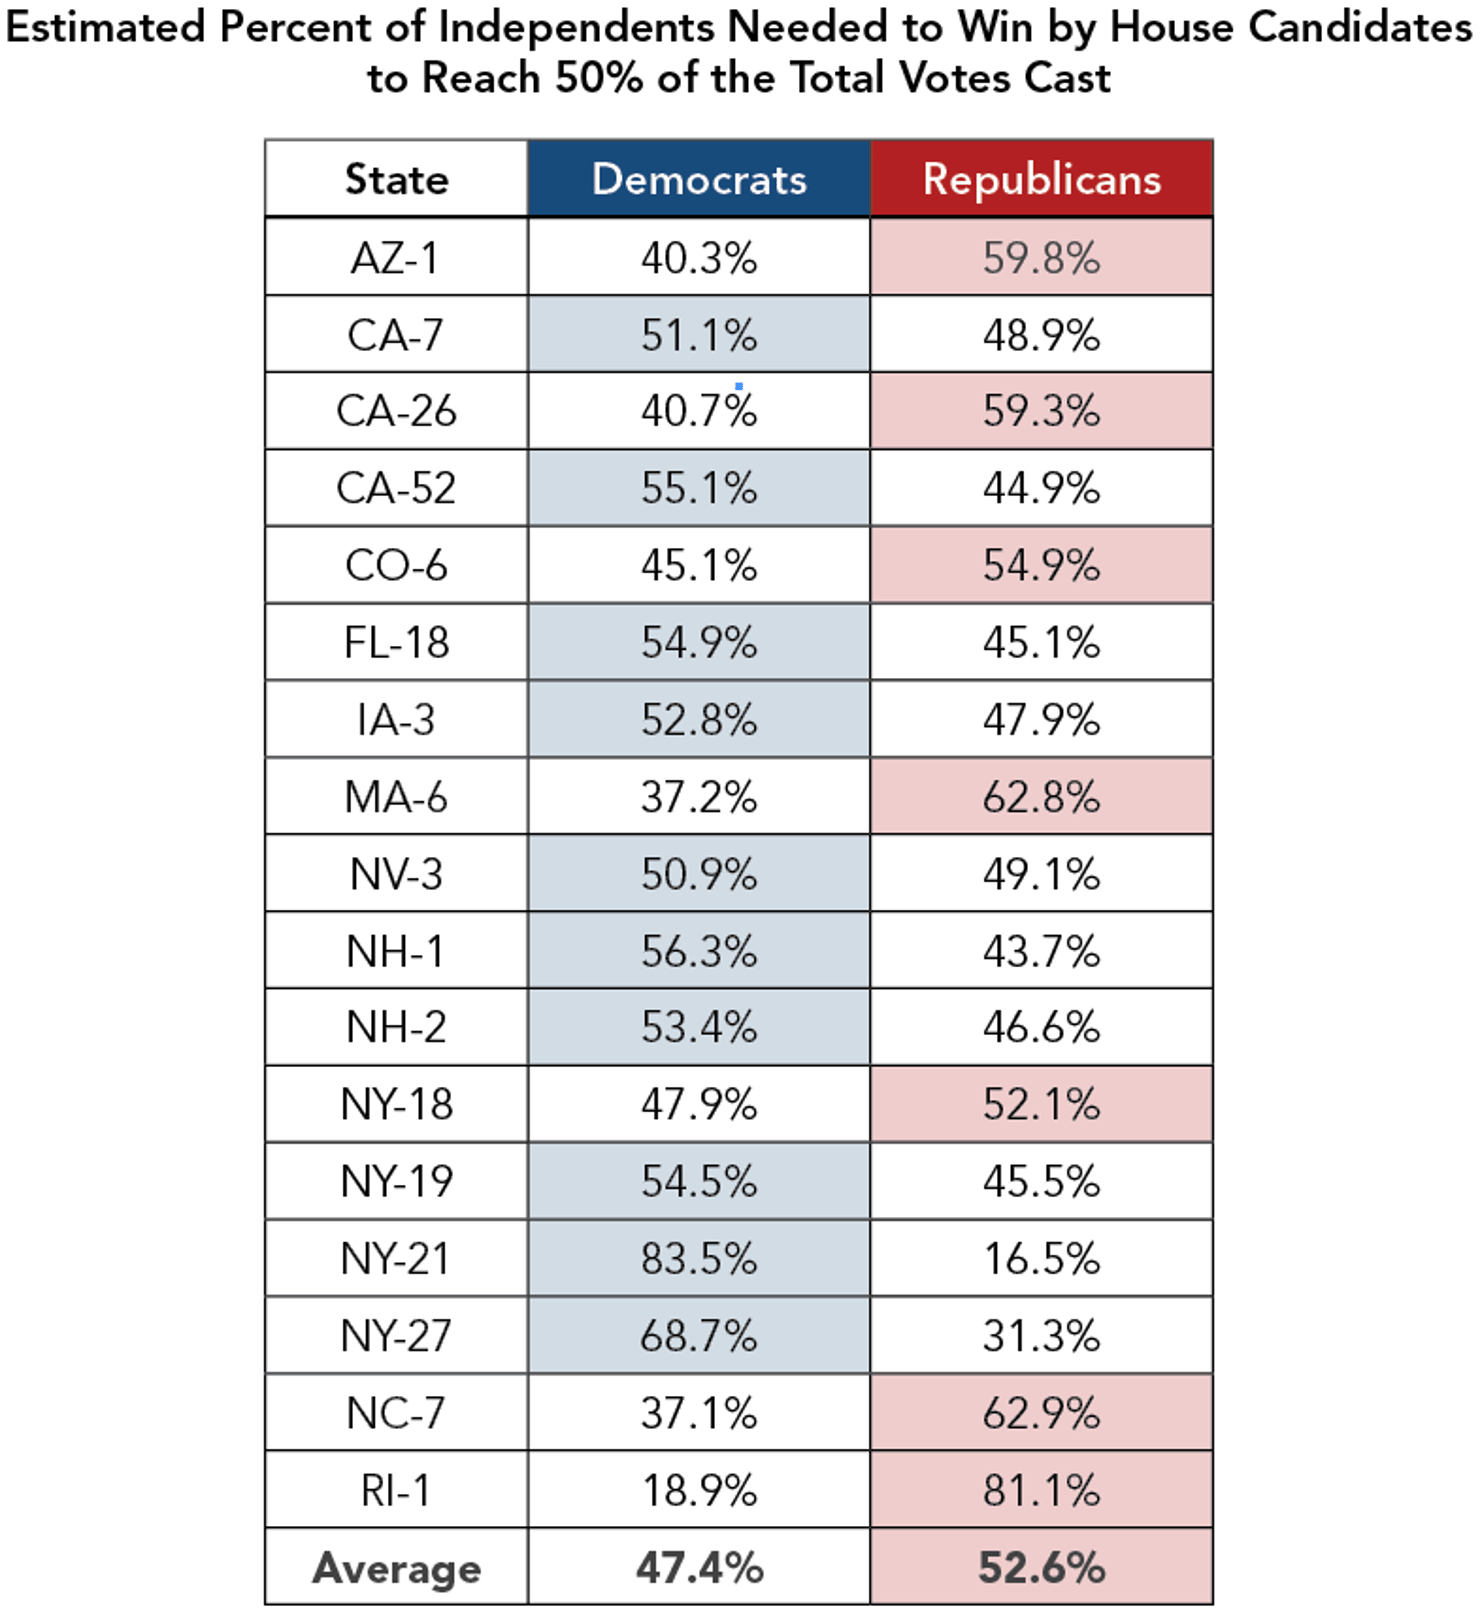
Of the 17 toss-up districts, our model finds that Democrats would need to win more Independents than Republicans in 10 of the 17 districts. Republicans would need to win more Independents than Democrats in 7 districts to be victorious in November.
California’s 7th Congressional District and Nevada’s 3rd may be the most competitive, with the smallest difference between the percent of Independents the Democratic and Republican candidates would need. In California’s 7th, Democratic candidate Ami Bera would need 51.1% of Independents while incumbent Rep. Dan Lungren would need 48.9%, a difference of 2.2 points. In Nevada’s 3rd, Democratic candidate John Ocequera would need 50.9% of Independents while incumbent Rep. Joe Heck would need 49.1%, a difference of 1.8 points.
Of course, the competitiveness of these and other districts will depend on what November’s electorate looks like—and how many Democrats, Republicans, and Independents turn out to vote. But the emerging picture is clear: the fault line in House battleground districts come November will be Independents.
Conclusion
In the likely House battleground districts this November, Independent voters make up nearly 3 in 10 voters—a greater share of registered voters than they do statewide or in presidential swing states. Assuming turnout mirrors voter registration, and Democrats and Republicans perform well among their own partisans, both candidates will need to win a sizeable chunk of Independent voters to claim victory this November.
Appendix A
Appendix B

Appendix C
Appendix D
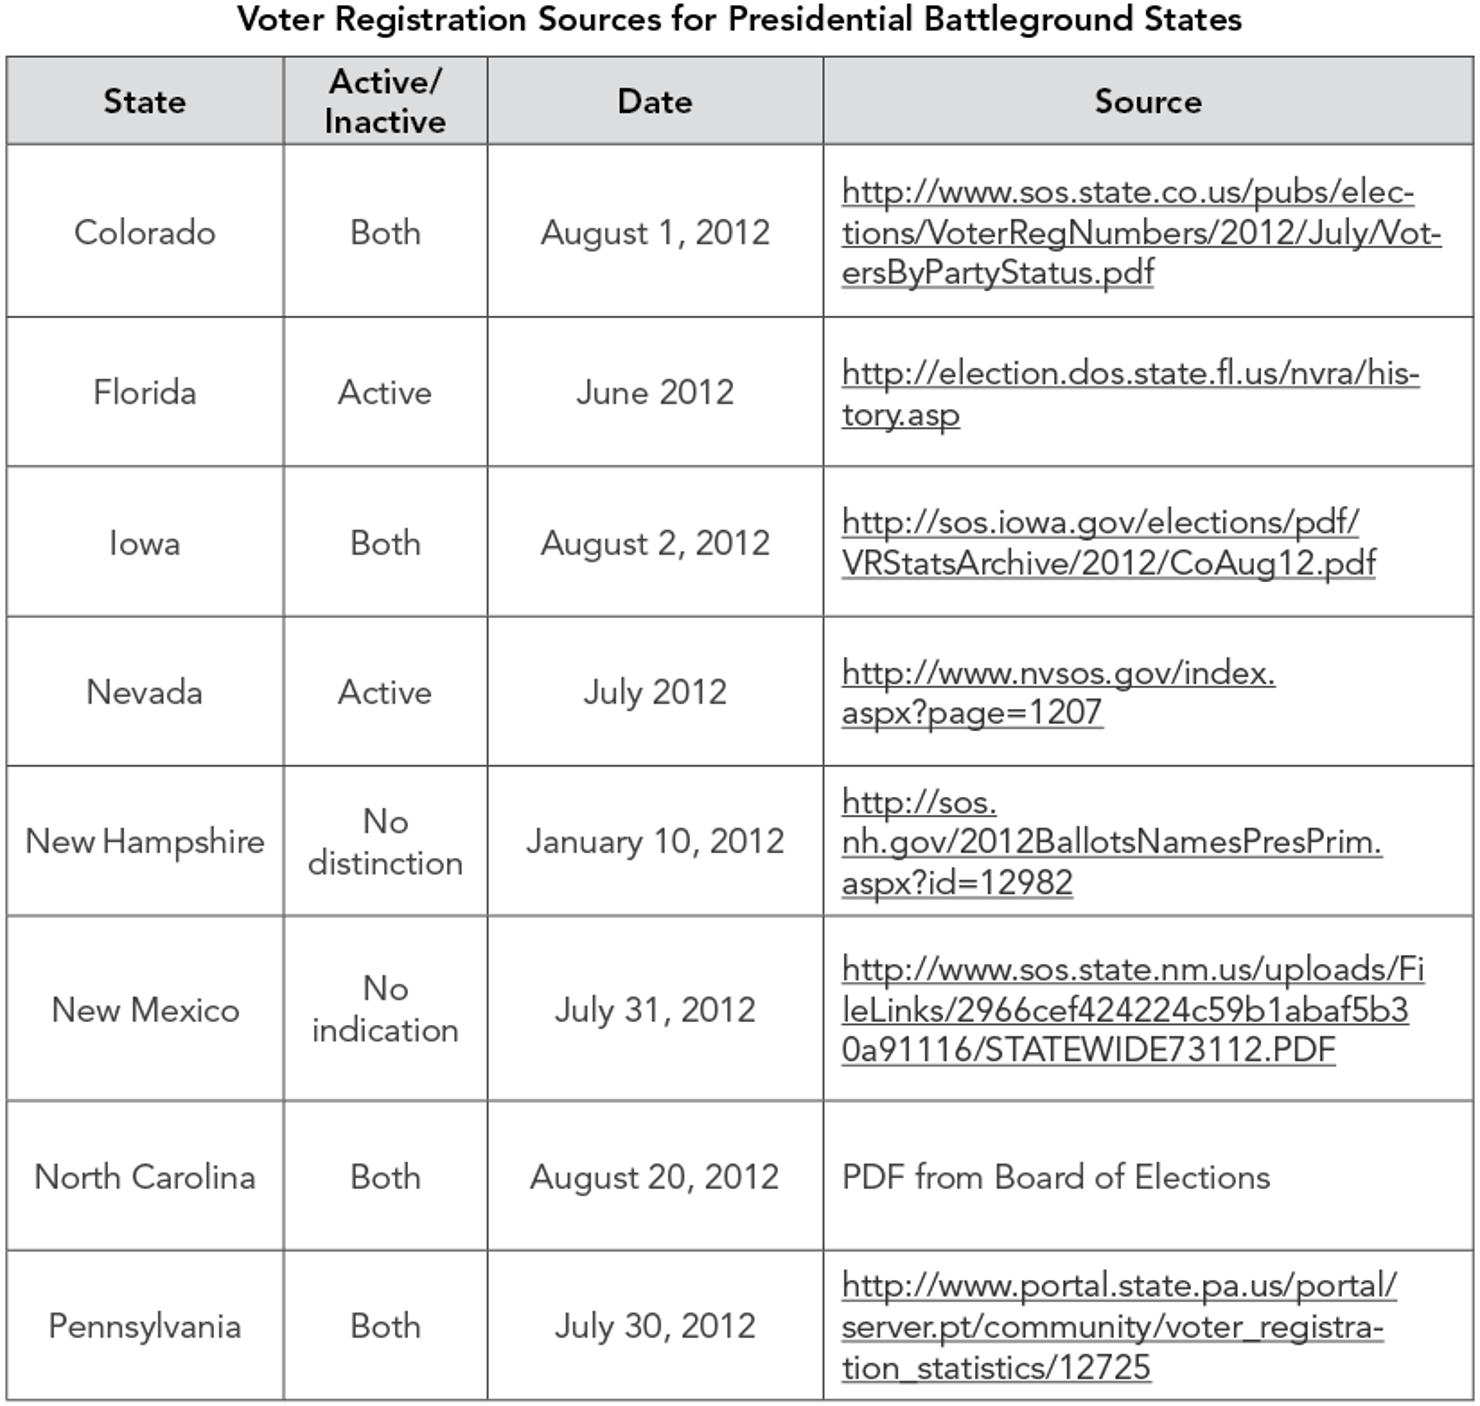
Appendix E
This section explains how we estimated the percent of Independents each candidate would need to reach 50% of our modeled November electorate in each district.
First, we modeled our hypothetical November electorate. To do this, we began by adding up the percent of the electorate composed of Democrats (DemElec), Republicans (RepElec), and Independents (IndElec) to determine the Estimated Votes Cast (EVC).
EVC = DemElec + RepElec + IndElec
Some districts only have 3 categories of voter registration statistics they report—Democrats, Republicans, and Independents (sometimes called Unaffiliated, Non Partisan, No Party, Other, or BVM-Blank Missing Void)—while some may have up to 9% registered in minor parties. Since exit poll data is not available to inform us as to how members of minor parties vote in Congressional elections, we excluded those voters from our analysis.
Next, we created a universe of Democratic and Republican voters who vote for the 2 major parties in Congressional Elections. According the House National Exit poll data (averages from 2004–2010), 99% of Democrats and 99.1% of Republicans voted for one of the 2 major parties. [The remaining 1% and 0.9%, respectively, did not report voting for one of the parties and may have voted for someone else or not voted for that office.] Since those votes were not available to the Democratic or Republican candidates to win, we excluded them from the Universe of Democratic (DemUni) and Republican (RepUni) votes a candidate could win.
DemUni = DemElec × 0.99
RepUni = RepElec × 0.991
Then we created a Universe of Potential Voters (UPV) the Democratic and Republican candidates would be actively competing for—thus modeling our November electorate.
UPV = DemUni + RepUni + IndElec
Once we had modeled our hypothetical November electorate, we estimated how many Independents each candidate would need to reach 50% of the UPV. To do this, we first divided our UPV in half to create a number of votes that would equal 50% of the UPV (UPVHalf). Then we subtracted the estimated number of Democrats (DemVotes) and Republicans (RepVotes) each candidate would win.
To estimate the number of votes each candidate was likely to win, we multiplied the DemUni by the likely Democratic performance among Democrats (DPD) and Republicans (DPR) and the RepUni by the likely Republican Performance among Republicans (RPR) and Democrats (RPD).
DemVotes = (DemUni × DPD) + (RepUni × DPR)
RepVotes = (RepUni × RPR) + (DemUni × RPD)
We then subtracted the DemVotes (for the Democratic candidate) and RepVotes (for the Republican candidate) from the UPVHalf to figure out the Number of Independents (DemNI and RepNI) each candidate would still need to reach the magic number of 50% of the modeled electorate.
DemNI = UPVHalf – DemVotes
RepNI = UPVHalf – RepVotes
Finally, we divided the number of Independents each candidate would need by the Independent electorate to determine the percent of Independents (%DemInd and %RepInd) each candidate would need to reach 50% of our modeled electorate.
%DemInd = DemNI ÷ IndElec
%RepInd = RepNI ÷ IndElec
Endnotes
“U.S. House National Exit Poll,” CNN, Accessed August 21, 2012. Available at: http://www.cnn.com/ELECTION/2006/pages/results/states/US/H/00/epolls.0.html.
“U.S. House National Exit Poll,” CNN, Accessed August 21, 2012. Available at: http://www.cnn.com/ELECTION/2010/results/polls/#val=USH00p1.
The rating agencies used for this memo are Cook Political Report, Rothenberg Political Report, and Sabato’s Crystal Ball. The 26 districts that were considered a toss-up by at least one rating agency on August 16, 2012 were: AZ-1; CA-7, 26, 52; CO-6; FL-18; IA-3; IL-11, 12, 17; MA-6; MI-1; MN-8; NV-3; NH-1, 2; NY-18, 19, 21, 27; NC-7;OH-16; PA-12; RI-1; TX-23; UT-4.
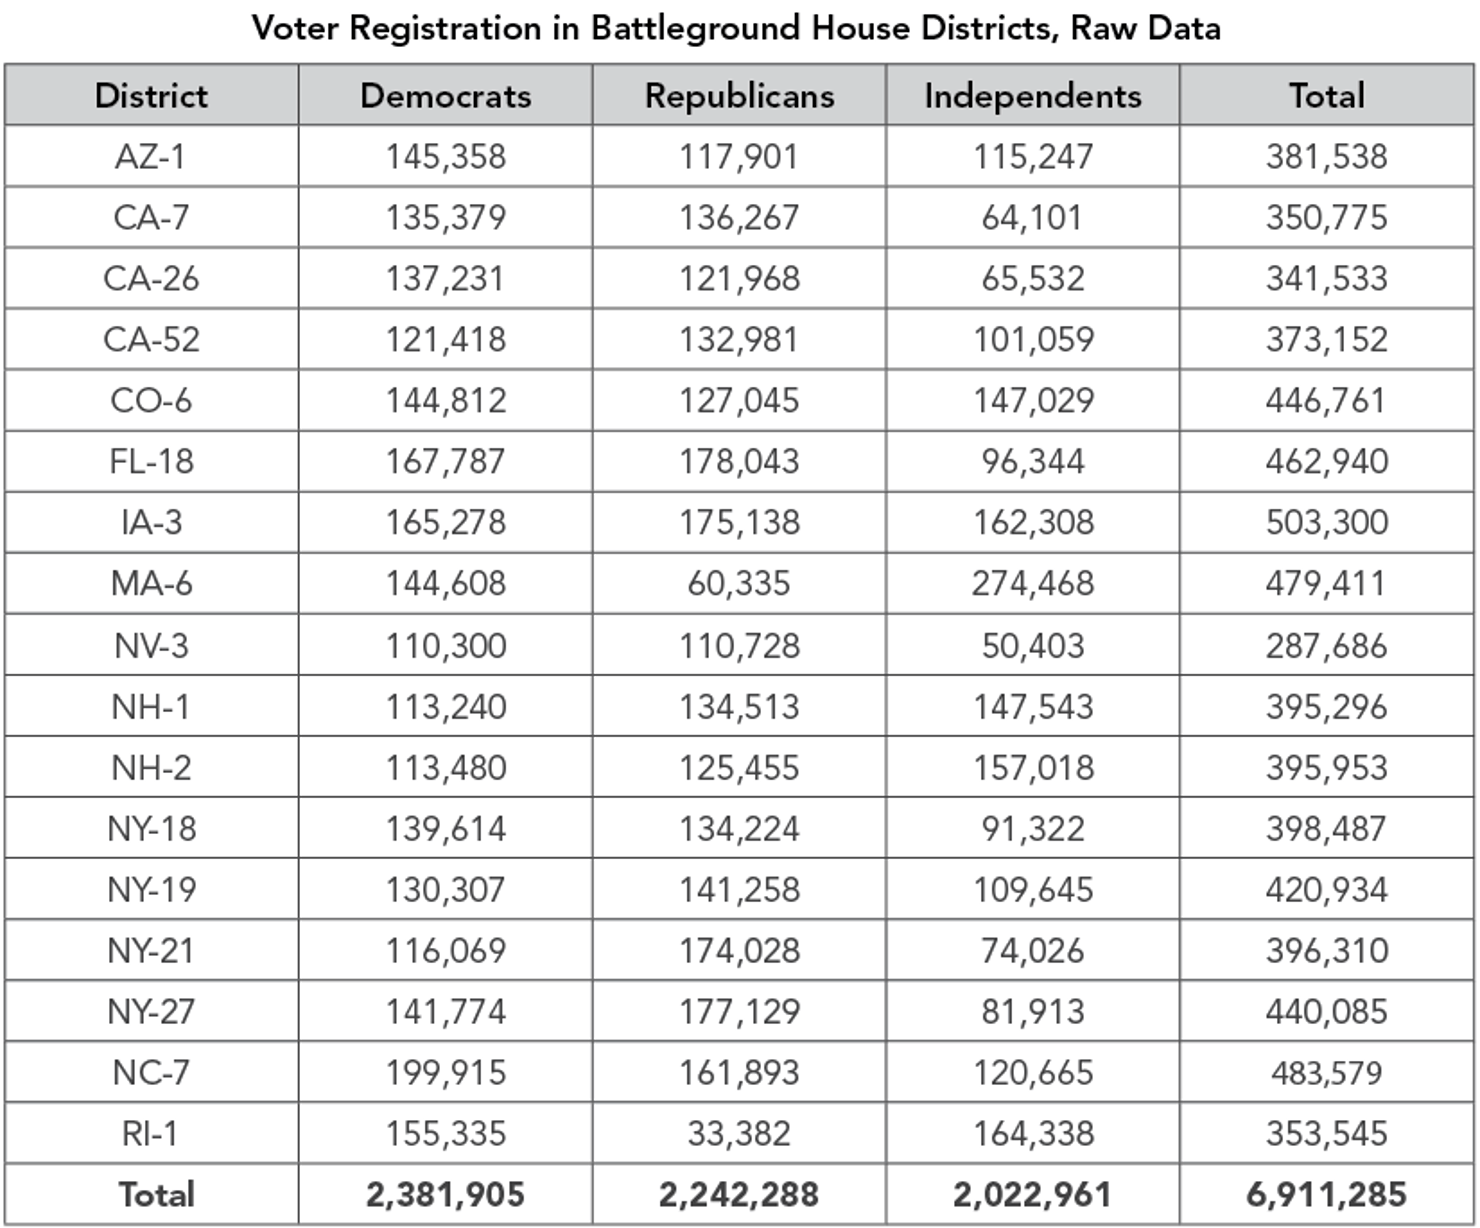
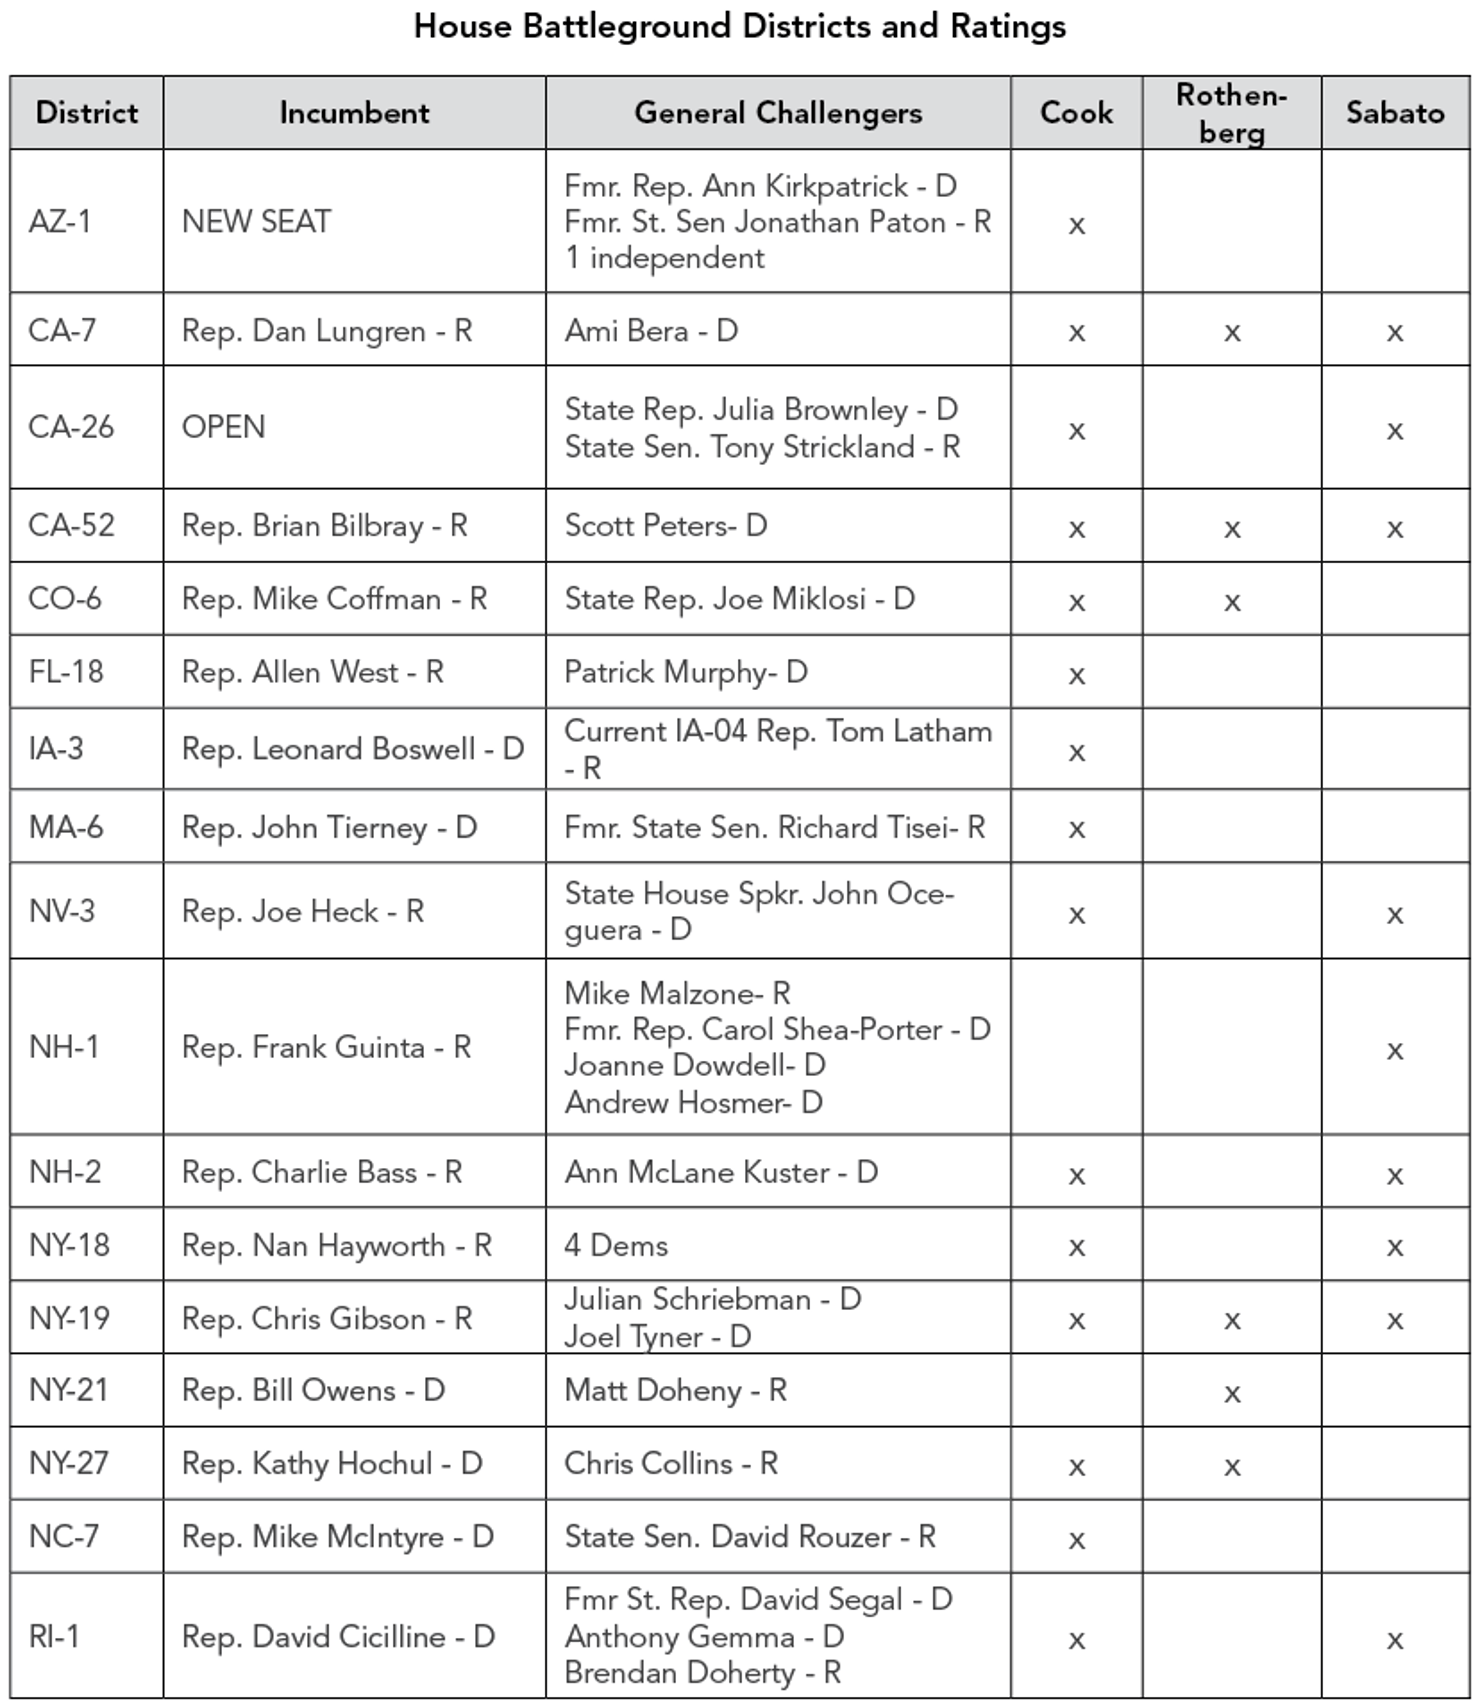
Raw voter registration data for each district is available in Appendix A. Descriptions of data (e.g., date updated, active/inactive enrollment) and citations are available in Appendix B. A list of candidates and race descriptions is available in Appendix C.
See Appendix D for sources for voter registration data in the presidential battleground states.
Our model estimates the number of Independents each candidate would need to win in order to reach 50% of the total votes cast. A detailed explanation of the model and the formulas used can be found in Appendix E.
“2004 U.S. House National Exit Poll,” CNN, Accessed August 23, 2012. Available at: http://www.cnn.com/ELECTION/2004/pages/results/states/US/H/00/epolls.0.html; “2006 U.S. House National Exit Poll,” CNN, Accessed August 23, 2012. Available at: http://www.cnn.com/ELECTION/2006/pages/results/states/US/H/00/epolls.0.html; “2008 U.S. House National Exit Poll,” CNN, Accessed August 23, 2012. Available at: http://www.cnn.com/ELECTION/2008/results/polls/#val=USH00p1; “2010U.S. House National Exit Poll,” CNN, Accessed August 23, 2012. Available at: http://www.cnn.com/ELECTION/2010/results/polls/#val=USH00p1.


More in Politics
View all Politics
The I's Have It: Pre-Convention Voter Registration Analysis
Senate Battlegrounds: Democrats Need a Moderate Majority