Report Published March 31, 2026 · 9 minute read
Explaining Federal Debt, Interest Rates, and the Economy
Middle-class families are feeling the effects of higher interest rates. Mortgage payments are rising, car loans cost more, and credit card balances accrue interest faster than they used to. Over the past several years, higher rates have reshaped household budgets across the country.
One reason behind that is Washington’s growing debt. When the federal government runs large deficits, it must borrow more by issuing Treasury bonds while simultaneously refinancing other obligations. This increased government borrowing can put upward pressure on interest rates across the broader economy.
It can be a difficult cycle. Larger deficits require more borrowing, which contributes to higher interest rates. Higher rates then increase the government’s own interest costs, leaving less room for other priorities and adding to future deficits.
New budget data from the Congressional Budget Office shows the problem is intensifying. Public debt already exceeds 100% of GDP and is projected to reach 120% by 2036.1 Over the same period, interest payments on the federal debt are set to double from $970 billion last year to over $2.1 trillion by 2036.2
The impact is felt across the entire economy. Notably, when interest rates rise, individuals are more likely to place their savings in government bonds rather than in private investments that finance business expansion, innovation, and job creation. Over time, reduced investment slows productivity growth, weakens wage growth, and makes it harder for small and mid-sized businesses to expand and hire.
In this report, we examine three important aspects of these dynamics:
- The bond market’s role
- How federal debt harms private investment
- Why budget deficits affect the economy and working families
The Role of Bond Markets
The bond market is where federal deficits translate into real-world borrowing costs—for the government and, ultimately, for everyone else. Understanding how bonds are priced, traded, and auctioned shows why rising debt can steadily push rates higher and why a loss of confidence can make that shift sudden.
How bonds work: The US bond market is large and highly liquid. In 2025, an average trading day saw between $900 billion and $1.1 trillion of US government bonds trading hands.3 A bond is essentially a loan: the issuer promises to repay a fixed amount on a specified date (its maturity), usually with periodic interest payments along the way and/or at the end.
A bond’s yield measures the annual rate of return that investors receive.4 It is determined by dividing the bond’s annual interest payment by its market price. Because those interest payments are fixed, yields move inversely with prices: when bond prices fall, yields rise, and when prices rise, yields fall.5
Changes in market interest rates drive these price movements. When interest rates rise, newly issued bonds offer higher payments than existing bonds, causing the prices of older bonds to fall. Conversely, when interest rates fall, existing bonds become more attractive because their payments are higher than those on new bonds, pushing their prices up and their yields down.6
US Treasury auctions: The federal government issues US Treasuries—bills and notes—through auctions. In FY 2025, the deficit was $1.8 trillion, but the US Treasury issued roughly $6.5 trillion in securities.7 That’s because roughly 15-20% of the nearly $39 trillion national debt must be refinanced in a typical year as old bonds come due.8
Bond vigilantes: Policymakers can face pressure from bond markets when investors view fiscal policy as inflationary or unsustainable. These investors—often called bond vigilantes—can sell bonds, pushing prices down and yields up. Higher yields increase the government’s borrowing costs and can force policymakers to reconsider policy changes.9
A recent example occurred in the United Kingdom in 2022. Prime Minister Liz Truss’s administration announced a budget plan containing unfunded, permanent tax cuts that would have increased the United Kingdom’s deficits by 1.5% of GDP, to a total of 3.9%.10 The lack of debt-reduction strategy and the unfunded nature of the plan caused the UK’s 30-year security yield to surge 1.6% in three days as investors rapidly repriced UK government debt.11
The US is not immune from bond shocks: The UK episode illustrated how quickly bond markets can react when fiscal policy undermines investor confidence. However, the United States differs in several important structural ways. The dollar is the world’s primary reserve currency, and US Treasury securities serve as the global benchmark safe asset. The Treasury market is also deeper and more liquid than any other sovereign bond market, and the Federal Reserve has the capacity to act as a lender of last resort when markets panic.
However, US economic structural advantages do not eliminate risk entirely. A US fiscal crisis would likely look less like a brief spike in yields and more like a sustained erosion in demand for Treasury securities.12 To attract investors, the government would have to offer materially higher yields.13 Over time, this dynamic could become self-reinforcing: rising debt can contribute to higher interest rates, higher rates slow economic growth, and weaker growth reduces revenue and increases borrowing needs—in addition to undermining confidence.14
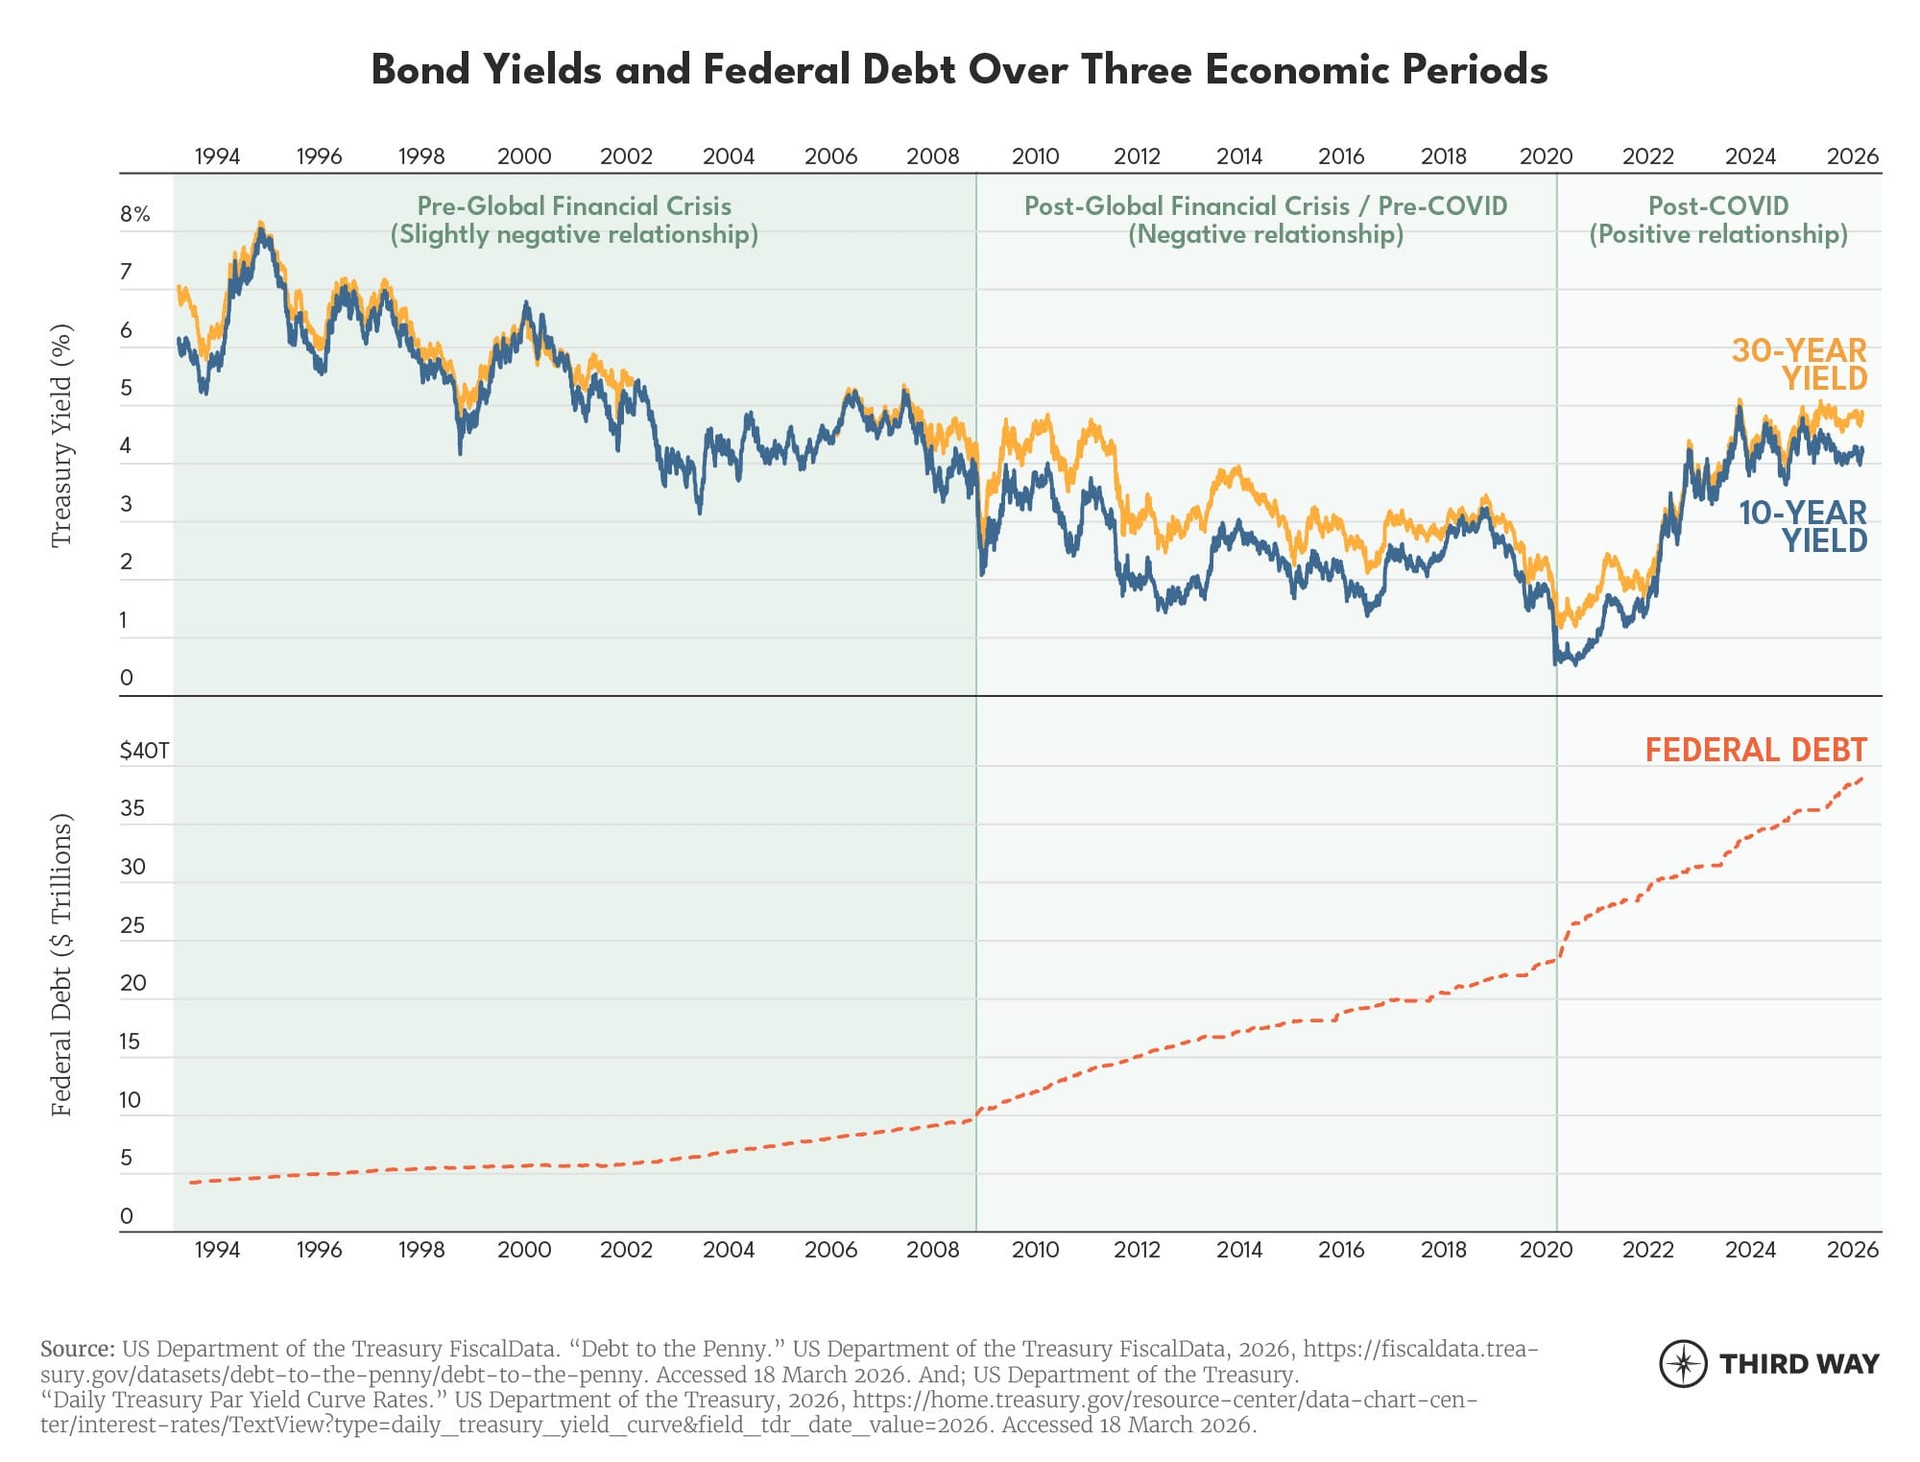
While higher debt can put upward pressure on interest rates and crowd out private investment, these effects are not automatic. As the chart shows, the strength and direction of the relationship vary across economic regimes and depend on broader financial and macroeconomic conditions.15 Today, the relationship shows policymakers should be concerned.
What the Federal Reserve can do: The Federal Reserve plays a central role in interest rates. It sets the federal funds rate, which strongly influences very short-term borrowing costs, and it can buy or sell longer-term Treasury securities through policies such as quantitative easing or tightening, affecting longer-term rates as well. However, it’s not the Fed’s mandate to manage US debt—it is to ensure both price stability (i.e., low inflation) and full employment.16
In the event of a fiscal crisis, the Federal Reserve would likely intervene, but the precise outcomes are uncertain. It could attempt to contain rising yields by purchasing Treasury securities or lowering target interest rates.17 But these actions are risky. If investors view large-scale bond purchases as debt monetization—effectively “printing money” to finance borrowing—inflation expectations could rise and demand for Treasury securities could weaken further. Federal Reserve action may prevent an immediate collapse in Treasury market functions. But the long-term consequences for inflation, financial stability, and the credibility of US fiscal and monetary institutions would remain uncertain.
Federal Debt Can “Crowd Out” Private Investment
There are two primary ways that rising deficits can depress private investment and weaken the economy: higher interest rates and portfolio substitution. Together, these are known as the “crowd out” effect.
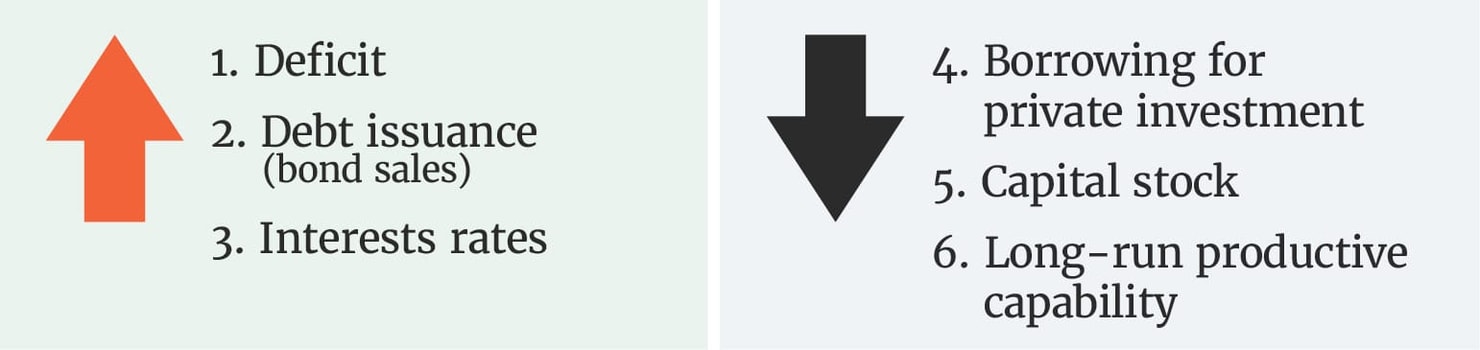
Higher interest rates: A persistently high deficit can crowd out private investment by pushing interest rates higher. When the government runs large deficits, it must issue more debt to finance its operations. As the supply of government bonds increases, yields may rise—particularly if investor demand does not keep pace. Because Treasury securities serve as the economy’s benchmark “risk-free rate,” higher Treasury yields tend to raise borrowing costs throughout the financial system.18
Higher private interest rates make borrowing more expensive for all purposes, including investment in things like machinery, buildings, and software.19 Because capital depreciates over time (e.g., a building needs a new roof, software needs an upgrade), firms must continually invest just to maintain it and even more to expand it.20 When higher borrowing costs reduce investment throughout the economy, the nation’s capital stock grows slower or even shrinks.
Slowing the growth of the nation’s capital stock hampers productivity and, ultimately, economic growth. Of course, other factors—including business cycles, recessions, Federal Reserve policy, and global capital flows—also affect investment-based productive capability.
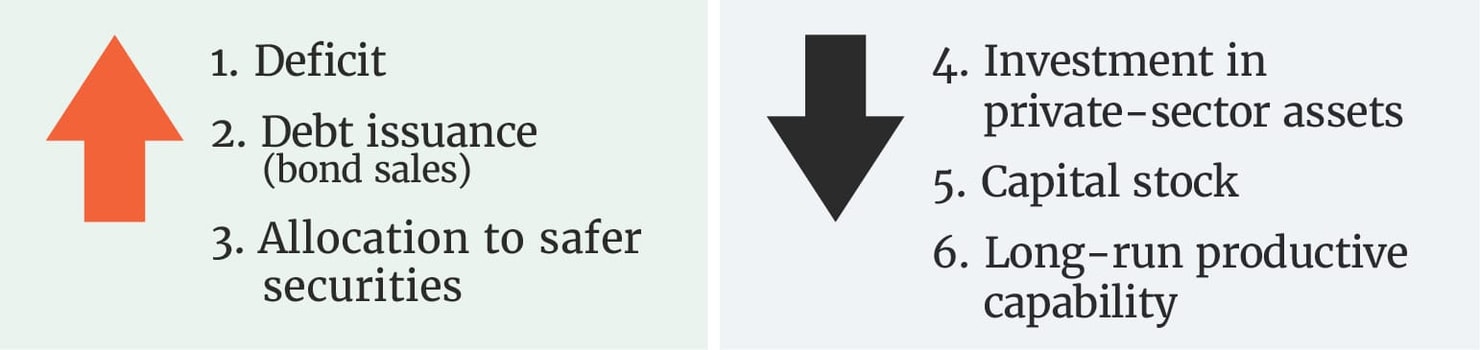
Portfolio substitution: When governments issue more debt, bonds become a larger share of available assets. Because government bonds like US Treasuries are considered among the safest assets, investors may shift their portfolios toward these safer securities and away from private-sector assets.21 As a result, a greater share of national savings may be directed toward the financing of national debt and away from productive private investment, limiting growth in the supply of capital stock.22
Effects on the Economy & Working Families
Families don’t eat capital, and you can’t dress your kids in productivity. But these forces still affect economic well-being—even for people without investments in the market.
Crowd-out can reduce economic growth: Over the past 20 years, US public debt has roughly doubled as a share of GDP. Economic models suggest that an increase of this magnitude could leave long-run GDP about 8% lower than it otherwise would have been.23
When government borrowing crowds out private investment, the economy accumulates less capital—machinery, buildings, and technology that help workers produce goods and services. With less capital, productivity and growth slow. The slices of the economic pie can still shift among groups, but a smaller or slower-growing pie makes broad prosperity harder to achieve.
The crowd-out burden is not shared evenly: Higher public debt is associated with lower levels of investment for small- and medium-size firms, which often depend more on borrowing to expand.24 At the same time, a smaller capital stock can slow wage growth for workers while putting upward pressure on returns to capital for existing owners, potentially widening inequality.25
It's unfair to younger people: Government borrowing allows current taxpayers to benefit from public spending today, but it leaves future generations with a heavier debt burden and greater uncertainty about their economic prospects.26
Conclusion
The warning lights in the federal budget are flashing, and the middle class will pay the price if Washington stays asleep at the wheel. High and rising debt matters for the real economy. Persistent deficits require constant, large-scale Treasury borrowing and refinancing. That can crowd out private investment by raising the cost of capital and diverting savings into government securities rather than productive private uses. When investment slows and the economy’s capital stock grows more slowly, productivity and wage growth weaken.