One-Pager Published November 9, 2012 · Updated November 9, 2012 · 3 minute read
The Big Shift: Why Marriage Won at the Ballot Box
Lanae Erickson & Sarah Trumble
This week, Americans in four states voted in favor of marriage for gay couples—making 2012 the first time in history that marriage has won at the ballot box. This incredible outcome relegates the past record of 32 losses to the dustbin of history, and it illustrates the rapid journey our country has taken on this issue since 2004. In our report, The Big Shift, we tracked this evolution using 128,000 responses from 98 national surveys, and our data shows that these victories were the result of one thing: Americans across every age, race, religion, party, ideology, and region reconsidered and decided to support allowing committed gay and lesbian couples to marry.
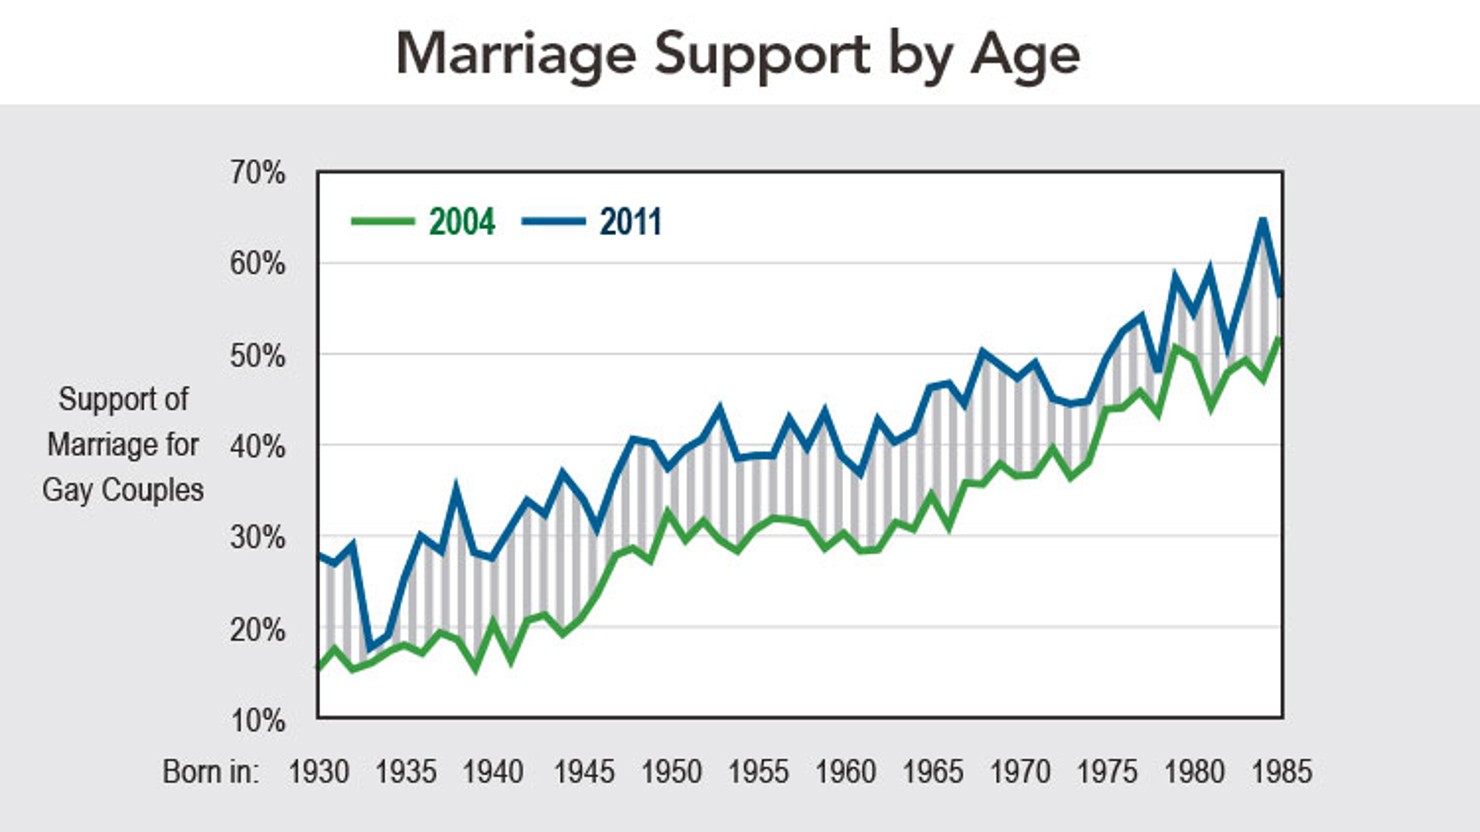
Support for marriage rose 16 points between 2004 and 2011 (when our data ends), and 75% of that shift was due to Americans of all ages changing their minds. Only a quarter was caused by younger, more accepting voters replacing older ones in the population.
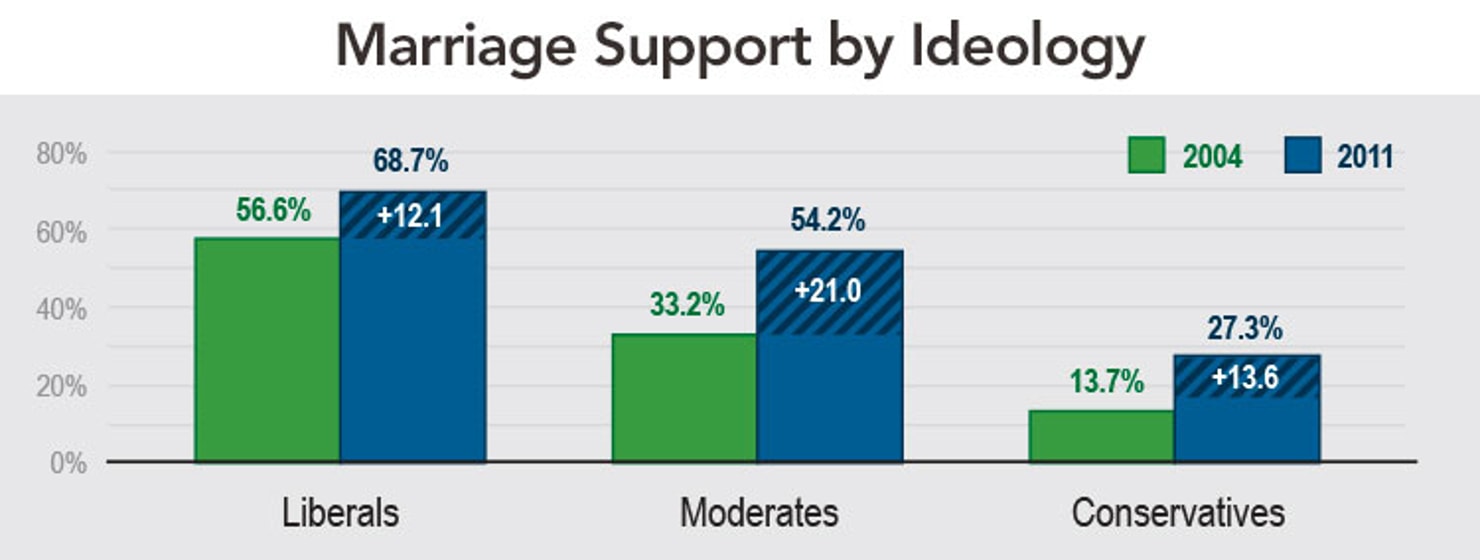
It wasn’t just liberal voters reconsidering—moderates moved faster than any other group, gaining 21 points of support for marriage between 2004 and 2011. And the number of conservatives who favor marriage doubled during that timeframe.
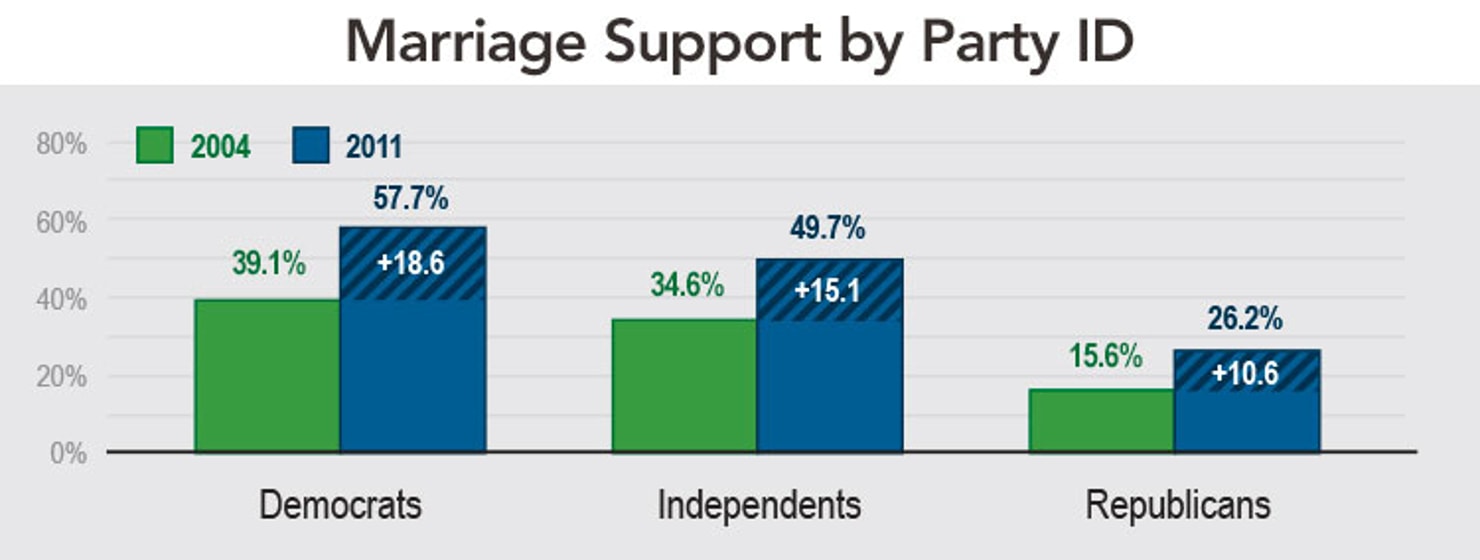
Americans of every political party warmed toward marriage for gay couples, with Independents tracking closer to Democrats and more than a quarter of Republicans now in the marriage camp—more than the proportion who says they are pro-choice.
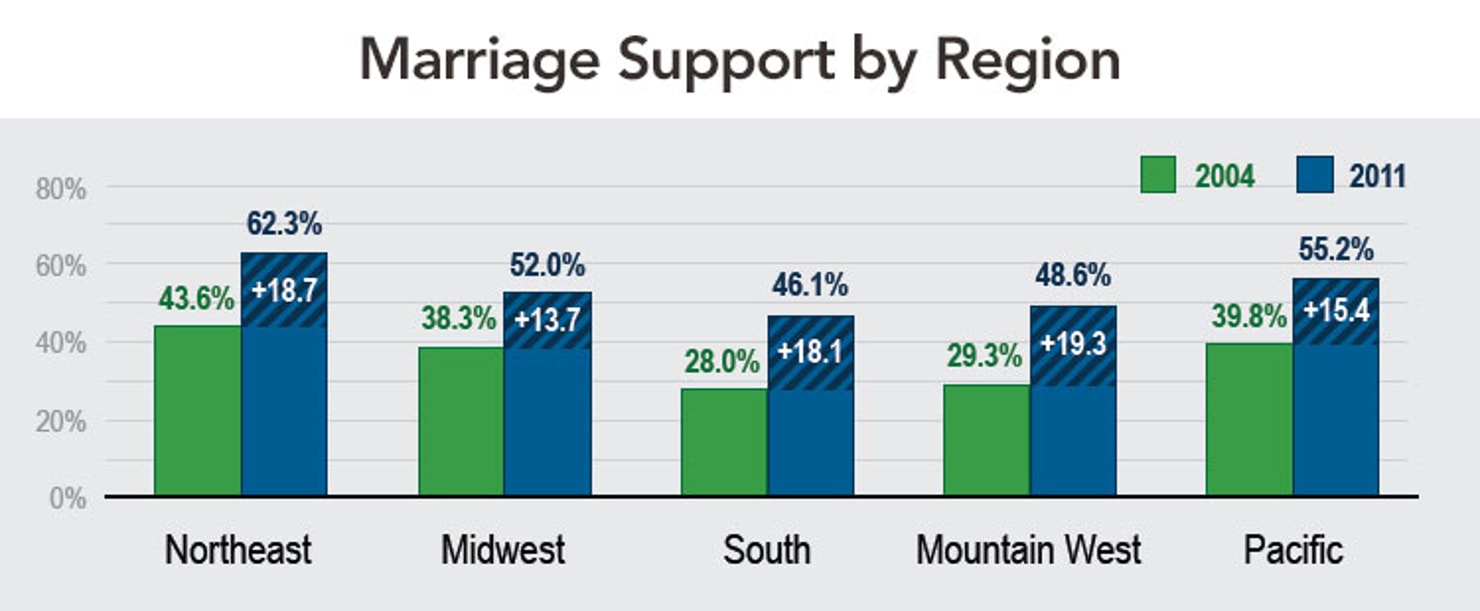
It’s not a surprise that the ballot initiative victories spanned the entire country—Americans of every region are growing more supportive of marriage, including in the South, where nearly a majority favor allowing gay couples to marry.
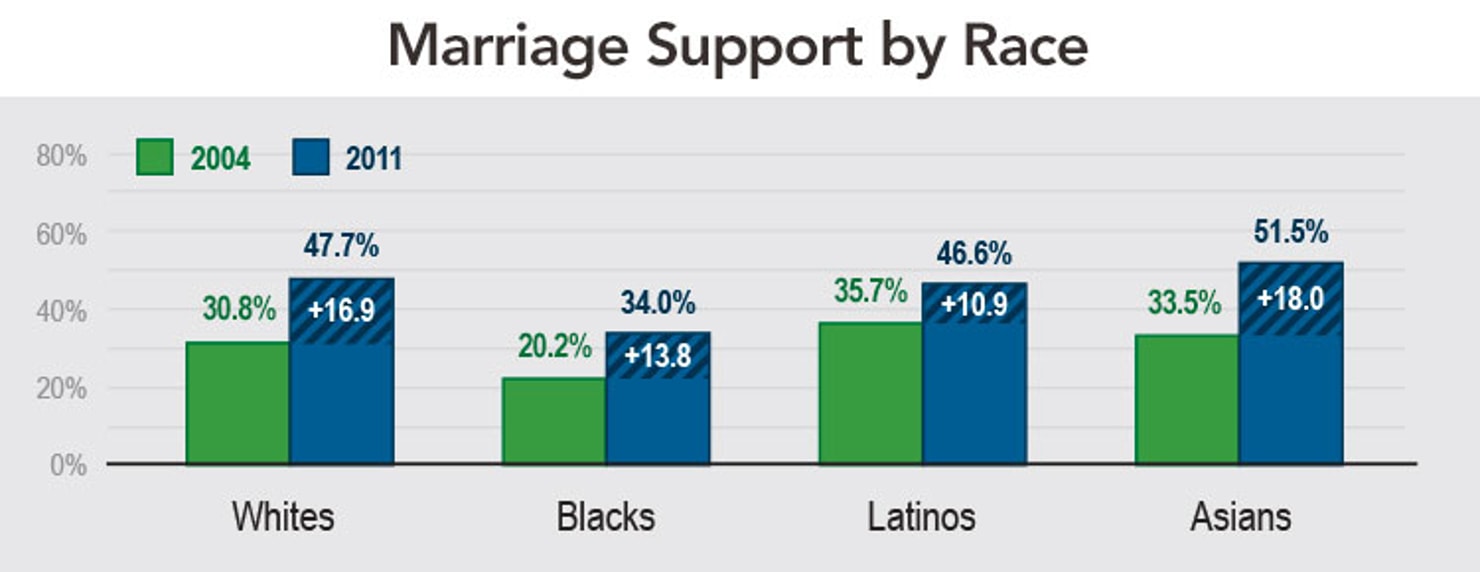
Across racial lines, Americans have been growing more supportive, with whites, Latinos, and Asians all nearing or crossing the majority support line by 2011. Views among African Americans are evolving rapidly as well, gaining 14 points between 2004 and 2011, and recent data suggests African American support has risen even more quickly over the last year.
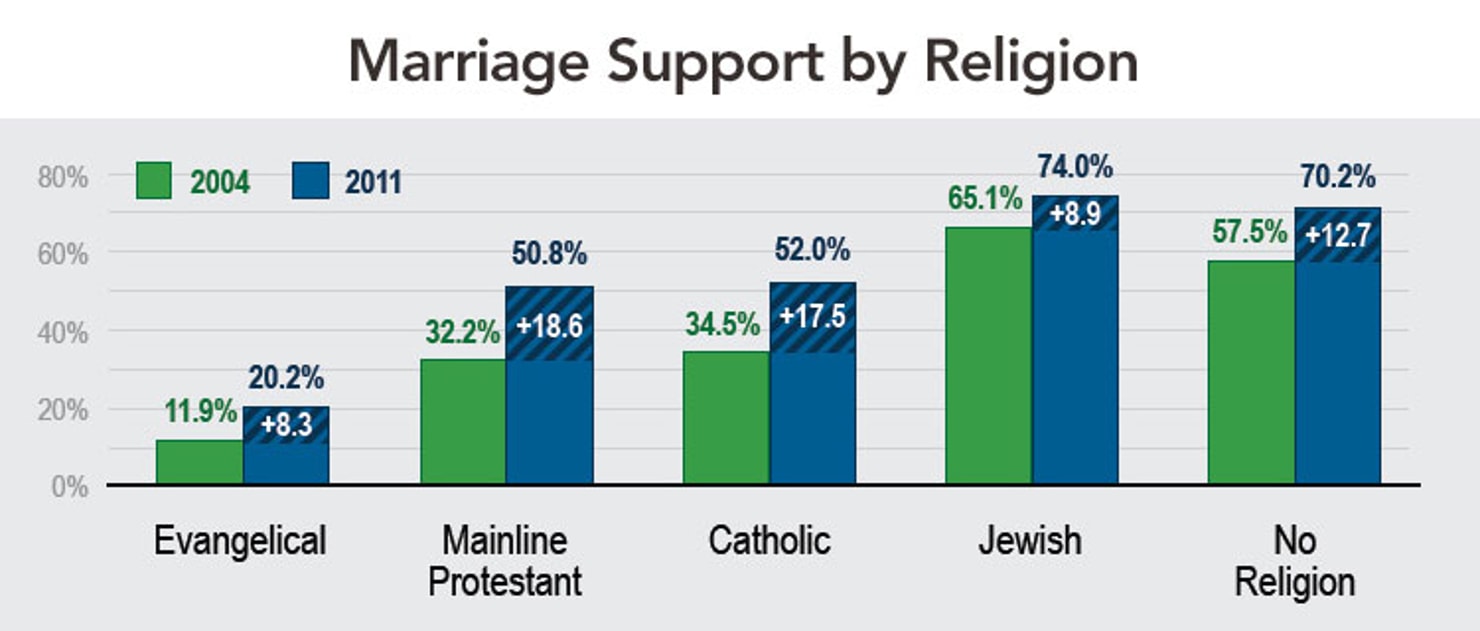
Even among Evangelical Christians, the religious group most resistant to marriage for gay couples, support has increased more than a point a year since 2004. Catholics and Mainline Protestants now boast majorities for marriage—and those numbers are growing.
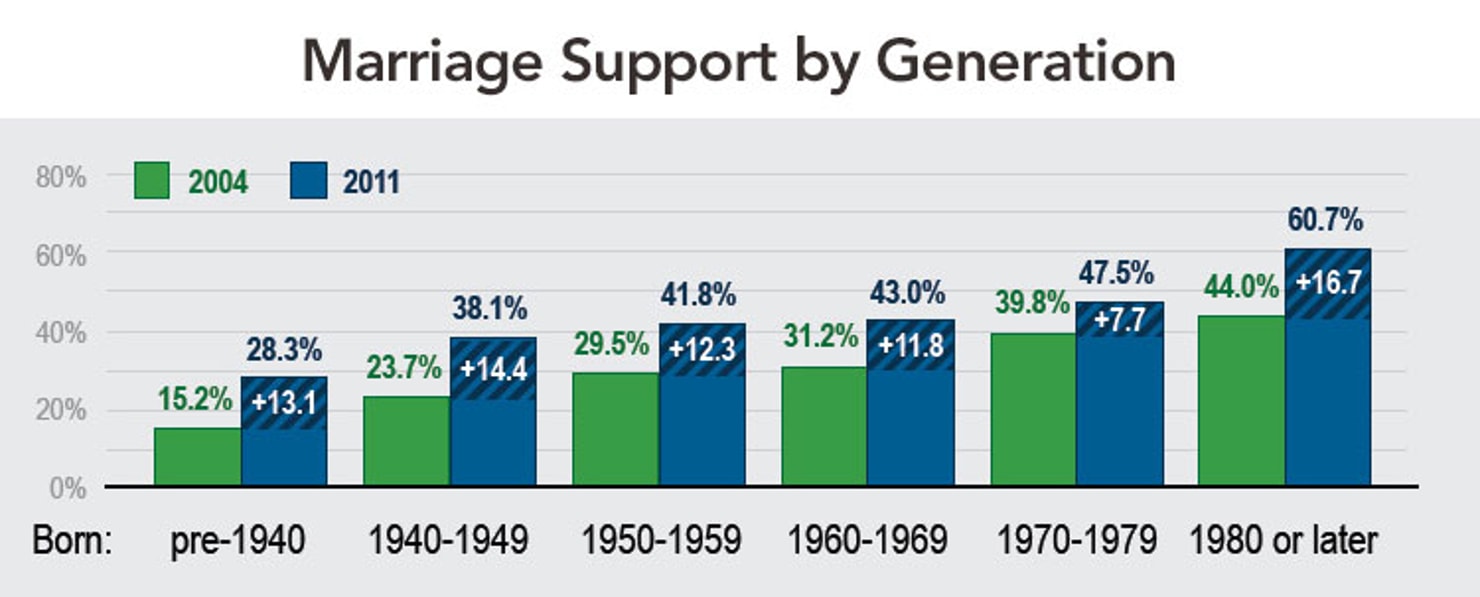
Young people are more supportive of marriage than their elders across every demographic group. In fact, our data indicates that the likelihood of favoring marriage goes up 0.8 points for each year of birth—meaning a person born in 1981 is 16 points more likely to support marriage than someone born in 1961. But Americans of every age are growing more accepting towards marriage for gay couples, with most cohorts gaining 12 points of support or more between 2004 and 2011.