Memo Published January 16, 2020 · 8 minute read
What You Need to Know About Trump’s Record on the National Debt
Jillian McGrath & Zach Moller

When he ran for president in 2016 Donald Trump said “We’ve got to get rid of the $19 trillion in debt…I think I could do it fairly quickly.”1 In fact in President Trump’s three years in office, the national debt has increased by $3 trillion.2
Donald Trump has a historically bad record on the budget:
- Under Trump’s failed fiscal policies, the deficit will reach $1 trillion this year for only the fifth time in American history.3
- Under Trump’s failed fiscal policies, the deficit will be more than $1 trillion every year in perpetuity.
- Under Trump’s failed fiscal policies, the deficit has increased nearly 70% in the 3 years since he took office.4
- Under Trump’s failed fiscal policies, the national debt will nearly equal the size of our entire economy within ten years.
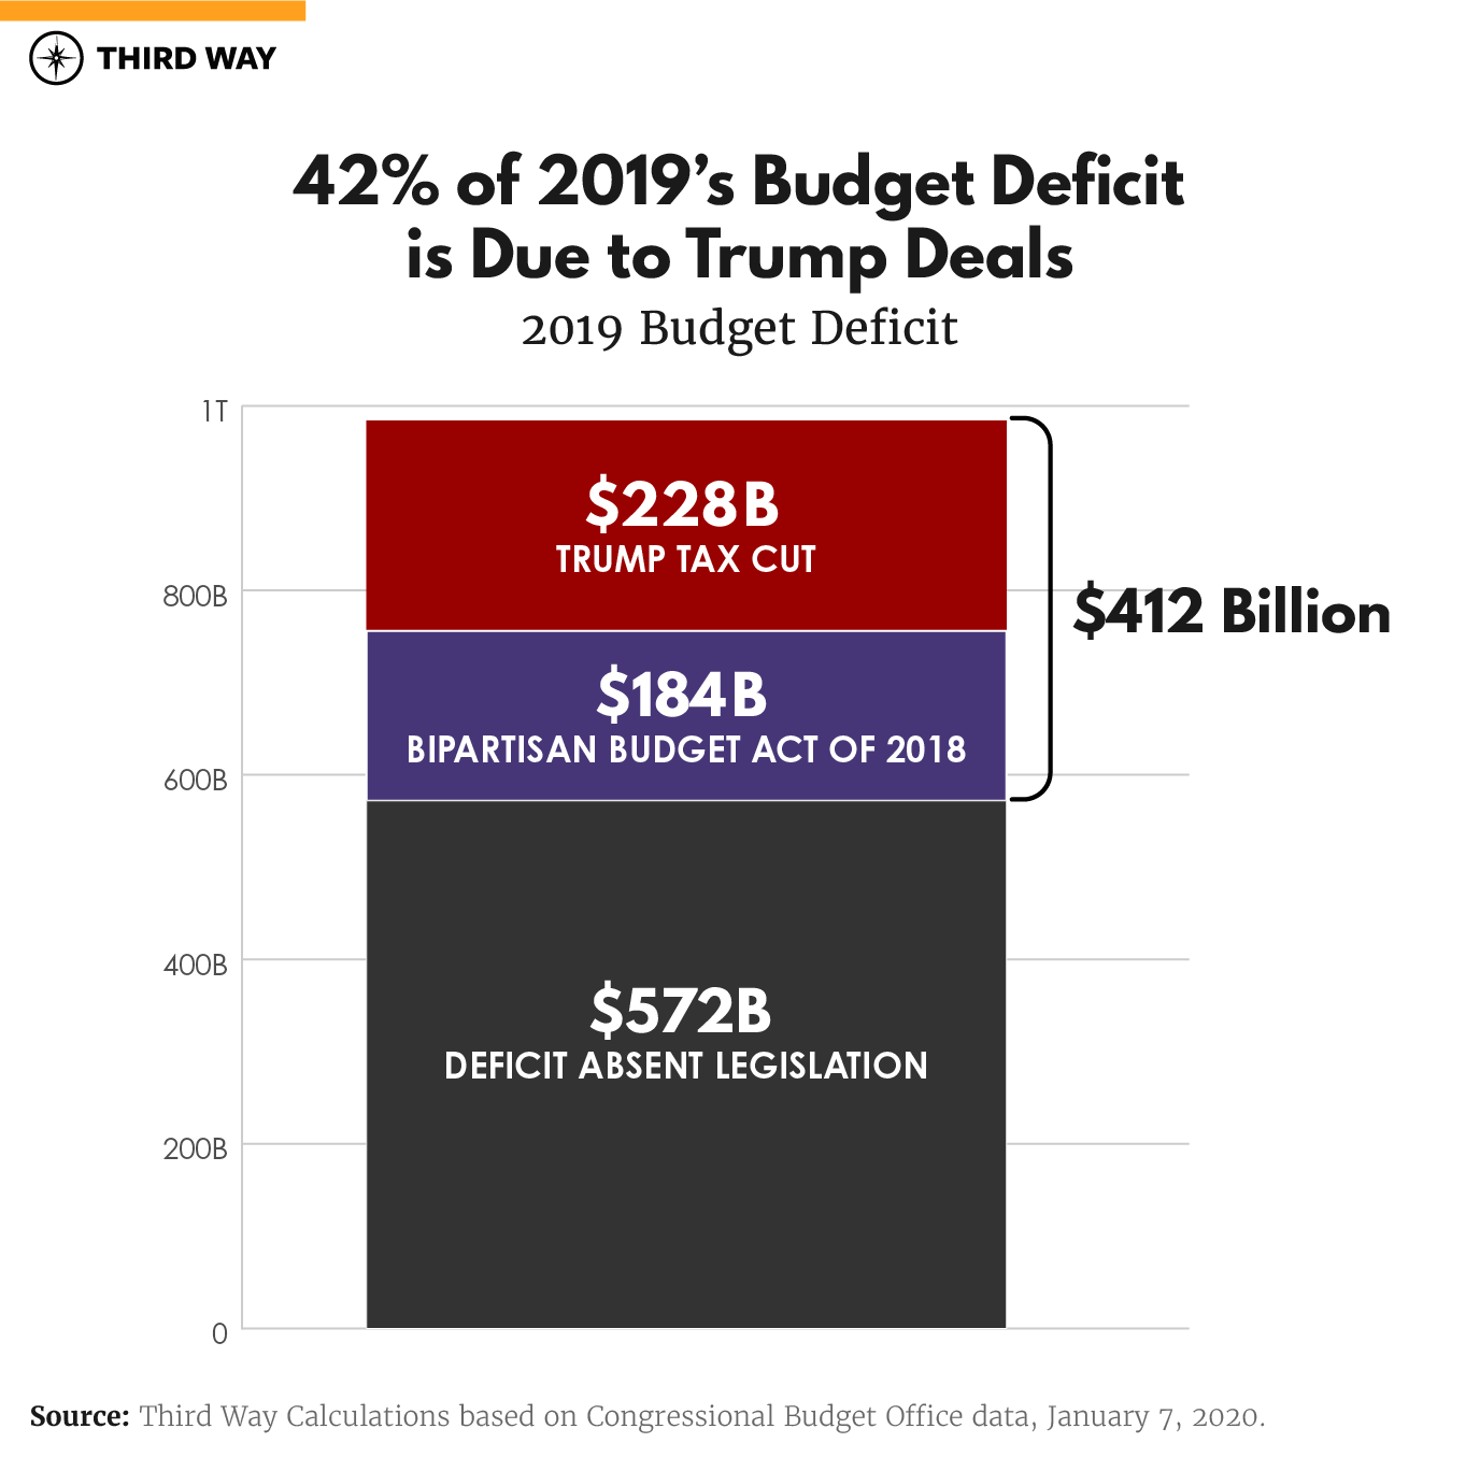
- Under Trump’s failed fiscal policies, his tax bill sparing the wealthiest from paying their rightful share in taxes was responsible for about 25% of 2019's deficit.
- Under Trump’s failed fiscal policies, the deficit is rising at the exact moment that it has fallen for past presidents – when the economy was growing, not shrinking.
The policy decisions made by his Administration have continued to put the country’s long-term health in jeopardy. A trade war to damage the economy, tax cuts that run up the deficit, and a focus on particularly wasteful spending: this is Trump’s dismal record on fiscal policy. And even his proposed cuts to spending are onerous, threatening working-class families across the country.
Under the relatively healthy economic times we are in, deficits should be shrinking, even with our particular budget challenges. With an aging population, more revenue from those at the top is required to service existing promises—not less, let alone to invest in other priorities for the future.
To understand the president’s impact on the fiscal health of the country, this memo unpacks Trump’s record on the deficit and debt, revenue, and spending.
Deficit and Debt
Facts
The Treasury Department reported the federal budget deficit was $984 billion for fiscal year 2019.5 This is the largest annual deficit since 2012.6 Compared to the size of the U.S. economy, the deficit grew to 4.6% of GDP.7According to most recent estimates from the Congressional Budget Office (CBO), this is expected to grow to $1.4 trillion by 2029.8
These reoccurring and growing deficits will result in a ballooning federal debt. The path we are now on is projected to reach a debt-to-GDP ratio (a standard comparison of the national debt to the size of the economy) of 95% in 2029 ($29 trillion debt held by the public).9 At this point, the amount the federal government owes its creditors will almost eclipse the value of goods and services produced in the US that year.
Rising deficits and debt are a problem for three reasons:
- Large amounts of federal debt as a share of the economy can depress economic output (GDP) over time.
- Rising interest rates will create an additional burden of financing federal debt, further compounding debt and deficit problems. In addition, these rising interest rates are felt by families and businesses in their borrowing.
- In the event of recession, there will be less real and perceived fiscal space for necessary economic stimulus to counteract a recession.
It is worth noting that even before Trump assumed office, the deficit was expected to grow substantially due to an aging population and growth in per capita spending on health care, meaning fiscal prudence would be required to overcome preexisting hurdles to an ever-expanding national debt and ultimately unsustainable path.10 The subsequent Trump tax cuts (known as the Tax Cuts and Jobs Act-TCJA) did not help the federal budgetary outlook.
Trump’s Record
Despite campaign promises to balance the budget, the annual deficit has risen $399 billion since President Trump took office, up to nearly $1 trillion from $585 billion at the end of FY 2016.11Increasing the federal deficit by over a third of a trillion dollars in only three years is far from a balanced budget.
Donald Trump is truly the king of debt. The debt has increased about $3 trillion since his first day in office.12 A stack of $1 bills this size would reach about 85% of the way to the moon.13
The U.S. economy has been fairly strong in the years leading up to Trump taking office and it has continued to perform well. Normally, deficits and debt (as a percent of GDP) should fall in strong economic conditions, providing fiscal capacity for lawmakers to appropriately respond when the economy eventually takes a turn for the worse. President Trump has done the opposite by running up the debt and deficit, squandering the opportunity to prepare for future recessions, and threatening an adequate response when the time comes.
Revenue
Facts
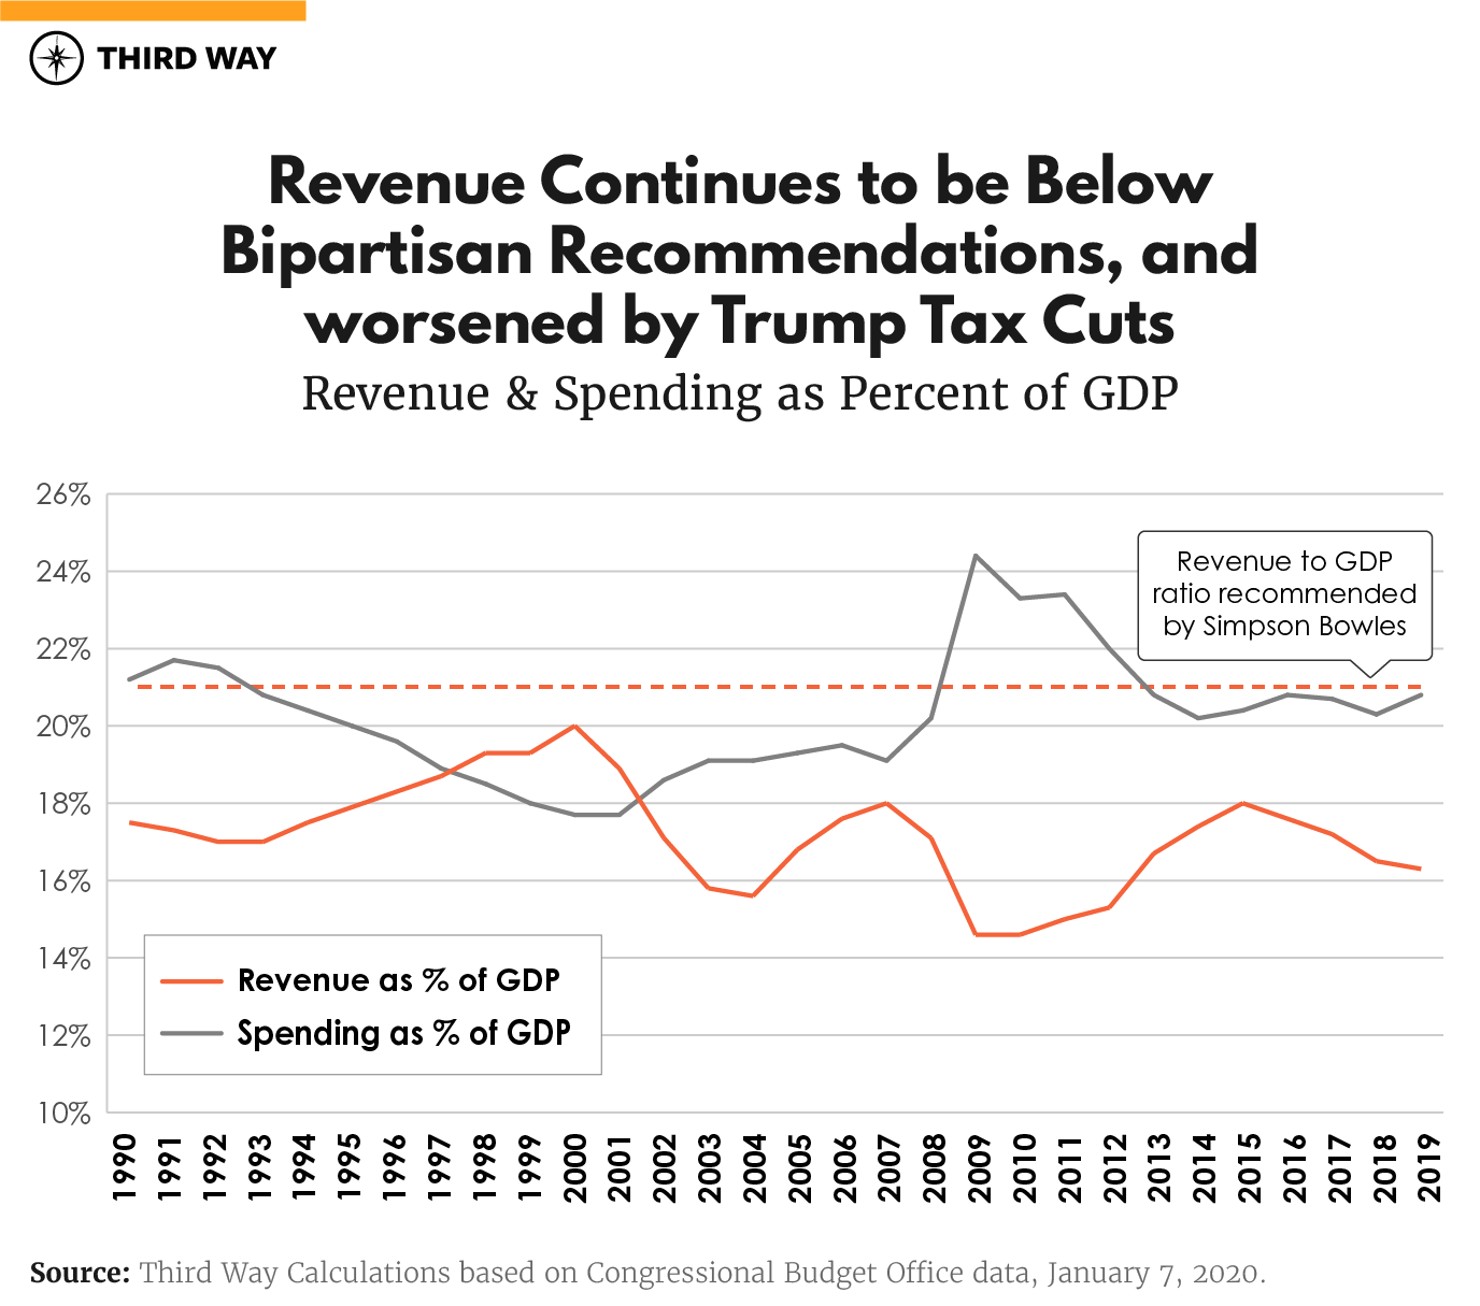
In FY 2019, the federal government took in just under $3.5 trillion in revenue, which is equivalent to 16.3% of GDP.14Revenues are expected to increase to 18.2% of GDP in 2029, primarily due to the expiration of personal income tax cuts in TCJA.15But that is incredibly low. When we last balanced the budget, in 2001, revenue stood at 18.9% of GDP.16And even the bipartisan Simpson-Bowles commission set up by President Obama concluded revenue would need to be as high as 21% of GDP to get our fiscal house in order.17
Additionally, the 2017 tax law is an incredibly expensive piece of legislation. In fact, TCJA represents $1.9 trillion in total cost, including debt service, in a 10 year period according to the CBO.18
Additionally, the U.S. is a very low tax country compared to other developed nations. The Organisation for Economic Co-operation and Development (OECD) estimated that seven countries (Austria, Belgium, Denmark, Finland, France, Italy and Sweden) had revenue-to-GDP ratios of above 40% in 2017.22 These rates are about two-and-a-half times larger than the revenue-to-GDP ratio of the United States in 2019.
Trump’s Record
President Donald Trump originally campaigned on $4.5 trillion in tax cuts.23In practice, he was able to settle on $1.5 trillion.24 But the benefit of the tax cuts was not widely distributed among all individuals. The nonpartisan Tax Policy Center found that higher-income households received a larger average tax cut as a percentage of after-tax income, with the largest cuts as a share of income going to taxpayers in the 95th to 99th percentiles of the income distribution, and still a substantial cut in taxes to the top 1% of earners.25
Poorly designed tax cuts that predominately benefit wealthy individuals, for example, waste significant resources for other critical investments. Investments in infrastructure, paid family leave, education, or combating climate change could have been done with similar resources. These policy options offer immense promise for advancing equity and growth, both things TCJA has failed to deliver.
The only revenue boon from the Trump administration has been the trade war. Protective tariffs raised $71 billion in revenue in FY 2019, however, this amount does not offset the cost to all American producers or consumers from reduced trade.26 For example, many dollars raised by protective tariffs have been matched by farm rescue funds used to offset the damage done by Trump’s haphazard trade war.27
Spending
Facts
Each year, Congress is required to fund the government through the appropriations process. However, only about one-third of federal spending is actually determined in this way. The remaining two-thirds of the federal budget is more or less on autopilot. This means that most of the money the federal government spends is determined by entitlement program enrollment (Social Security, Medicare, Medicaid) and servicing the national debt via interest payments.
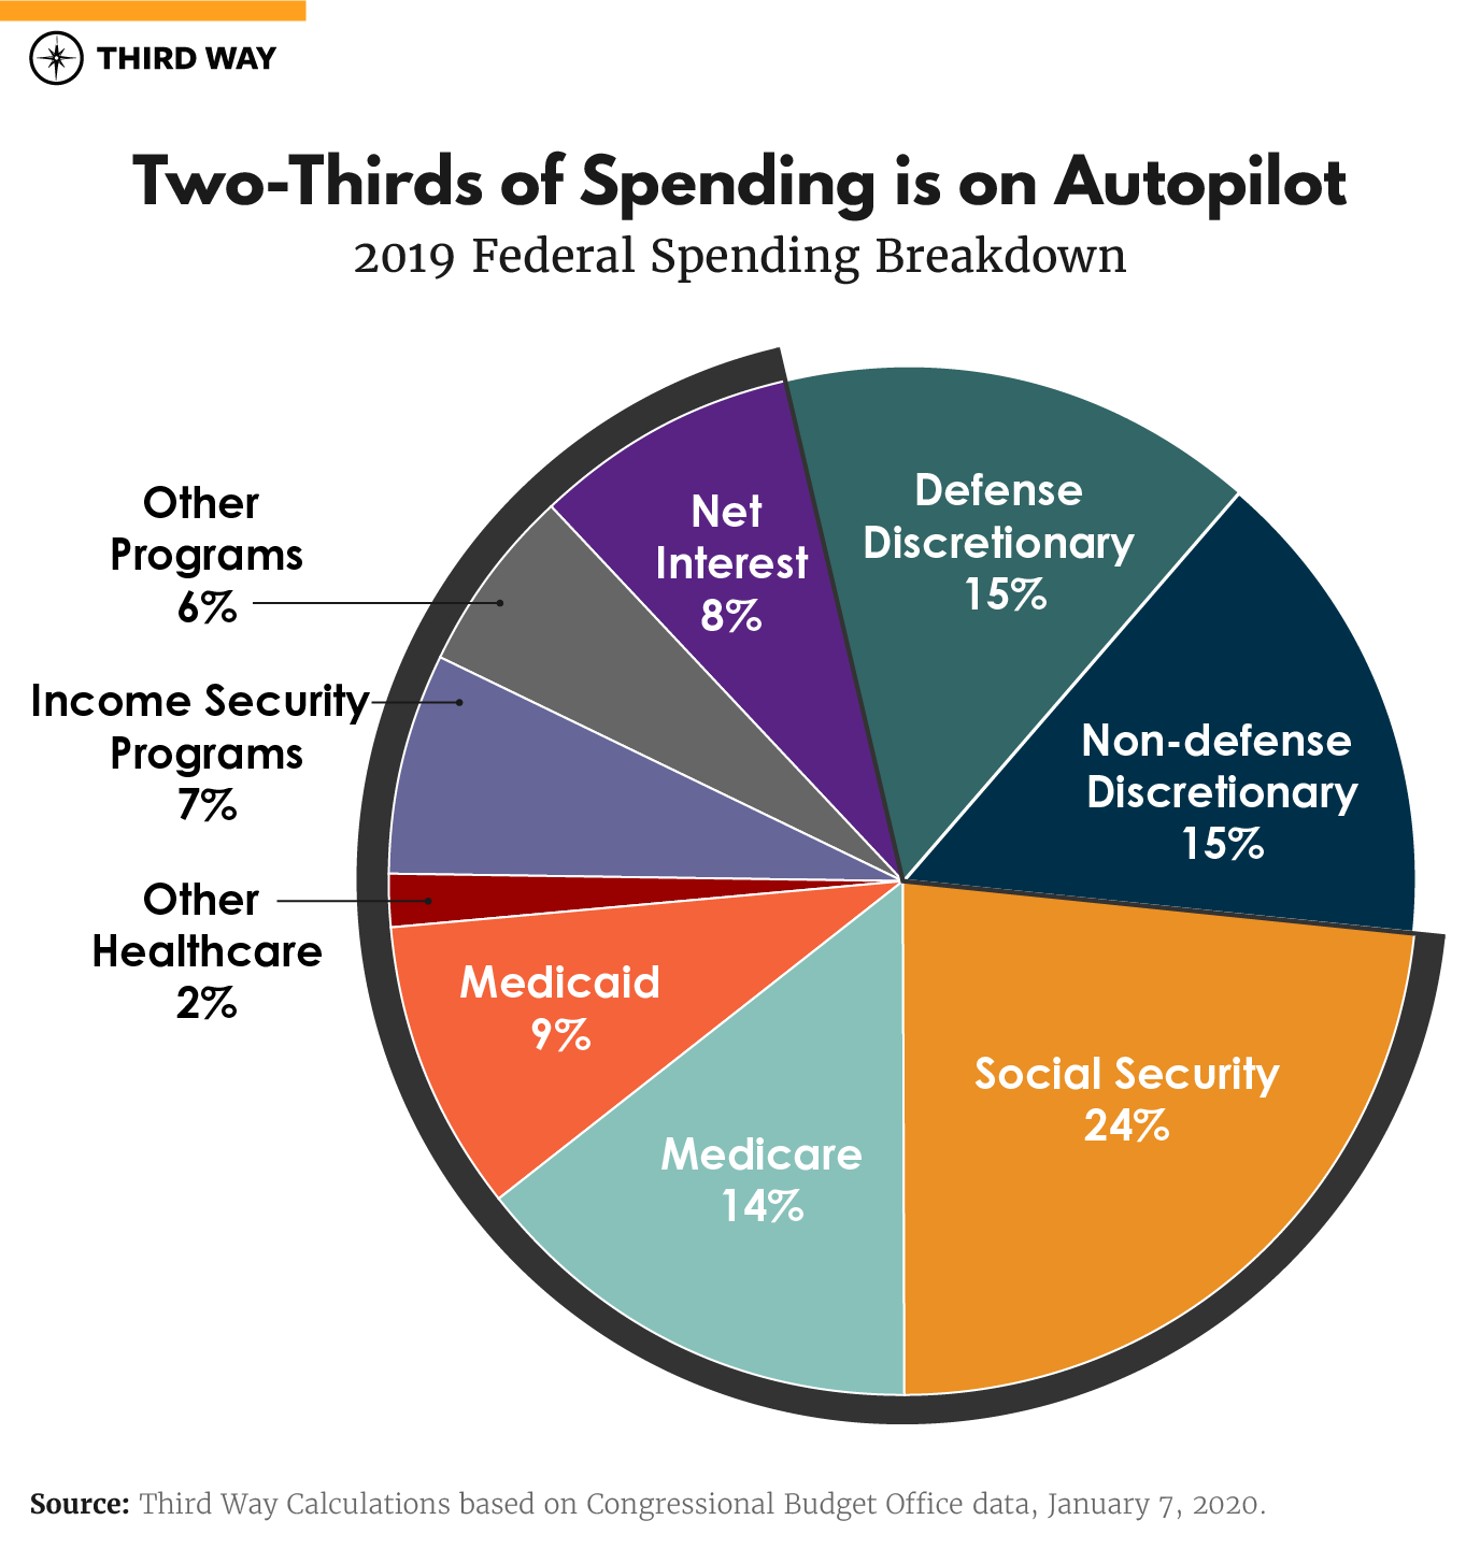
Other areas of guaranteed spending increase are the programs benefitting the elderly. The United States has an aging population, and as a result, spending on Medicare and Social Security is guaranteed to increase precipitously.
As the population ages and grows and prices rise, the government will have to spend more and more to provide the same services. Health care spending is an area of definitive price increase, meaning comparable service in 2019 will cost more in 2025 or 2029. These guaranteed spending increases could preclude proposed investments in other priorities, such as education, infrastructure, public health, or combatting climate change.
Trump’s Record
Trump has repeatedly pushed for wasteful spending on a variety of projects, most notably his southern border wall. The Office of Management and Budget estimated $5.7 billion would cover the cost of 234 miles of border wall, which is the equivalent of $24.4 million per mile.29 In addition, Trump’s focus on military spending (even more than requested by the Pentagon) led to the first unpaid for increase in capped discretionary spending subject to the 2011 Budget Control Act.30
Additionally, the areas Trump has actually proposed spending cuts would have disastrous effects for low income and vulnerable Americans. President Trump’s FY 2020 budget proposed a 30% cut to SNAP, a 12% cut to WIC, and a 13% cut to Section 8 by the year 2029.31 These programs provide food and nutrition assistance as well as affordable housing to low-income Americans, meaning President Trump’s proposed savings will deeply harm families and children in need.