Skip to content

Memo Published December 11, 2025 · 5 minute read

What to Know About Interest Spending and Crowd Out

Annie Shuppy & Zach Moller

Jump to section...
HG What to know about Interest Spending and Crowd Out v2

Last year, the federal government spent nearly $1 trillion on interest due to our $30 trillion national debt (debt held by the public).1 That money did not feed families, strengthen national defense, or invest in our long-term economic growth. It simply had to be paid to bondholders—foreign and domestic—because of past spending decisions. Rising interest costs act as a budgetary anchor, dragging today’s taxpayers down to finance yesterday’s choices at the expense of tomorrow’s opportunities.

Interest spending is now the fastest-growing part of the federal budget, and it is projected to keep climbing as debt accumulates and interest rates remain elevated. Policymakers cannot negotiate these payments or push them off; the federal government must pay its interest or risk default. As a result, higher interest costs squeeze discretionary spending, worsen intergenerational inequities, and leave fewer resources for core national investments like infrastructure, research, education, and support for children and families.

This memo outlines the scale of the interest-spending problem in today’s post-tax cut environment, explains why these costs provide no economic return, and describes how rising federal debt crowds out both public and private investment. Understanding the magnitude of this challenge is essential to charting a new course for our budget future.

OBBBA Made High Interest Spending Worse 

As the national debt grows, the federal government must devote more of the budget to interest spending. Interest is currently the third-largest budget item ($881 billion in FY 2024, $970 billion in FY 2025), larger than Medicaid ($618 billion in FY 2024, $688 billion in FY 2025) and defense ($874 billion in FY 2024, $917 billion in FY 2025).2 Only Medicare and Social Security exceed interest spending, for now. 

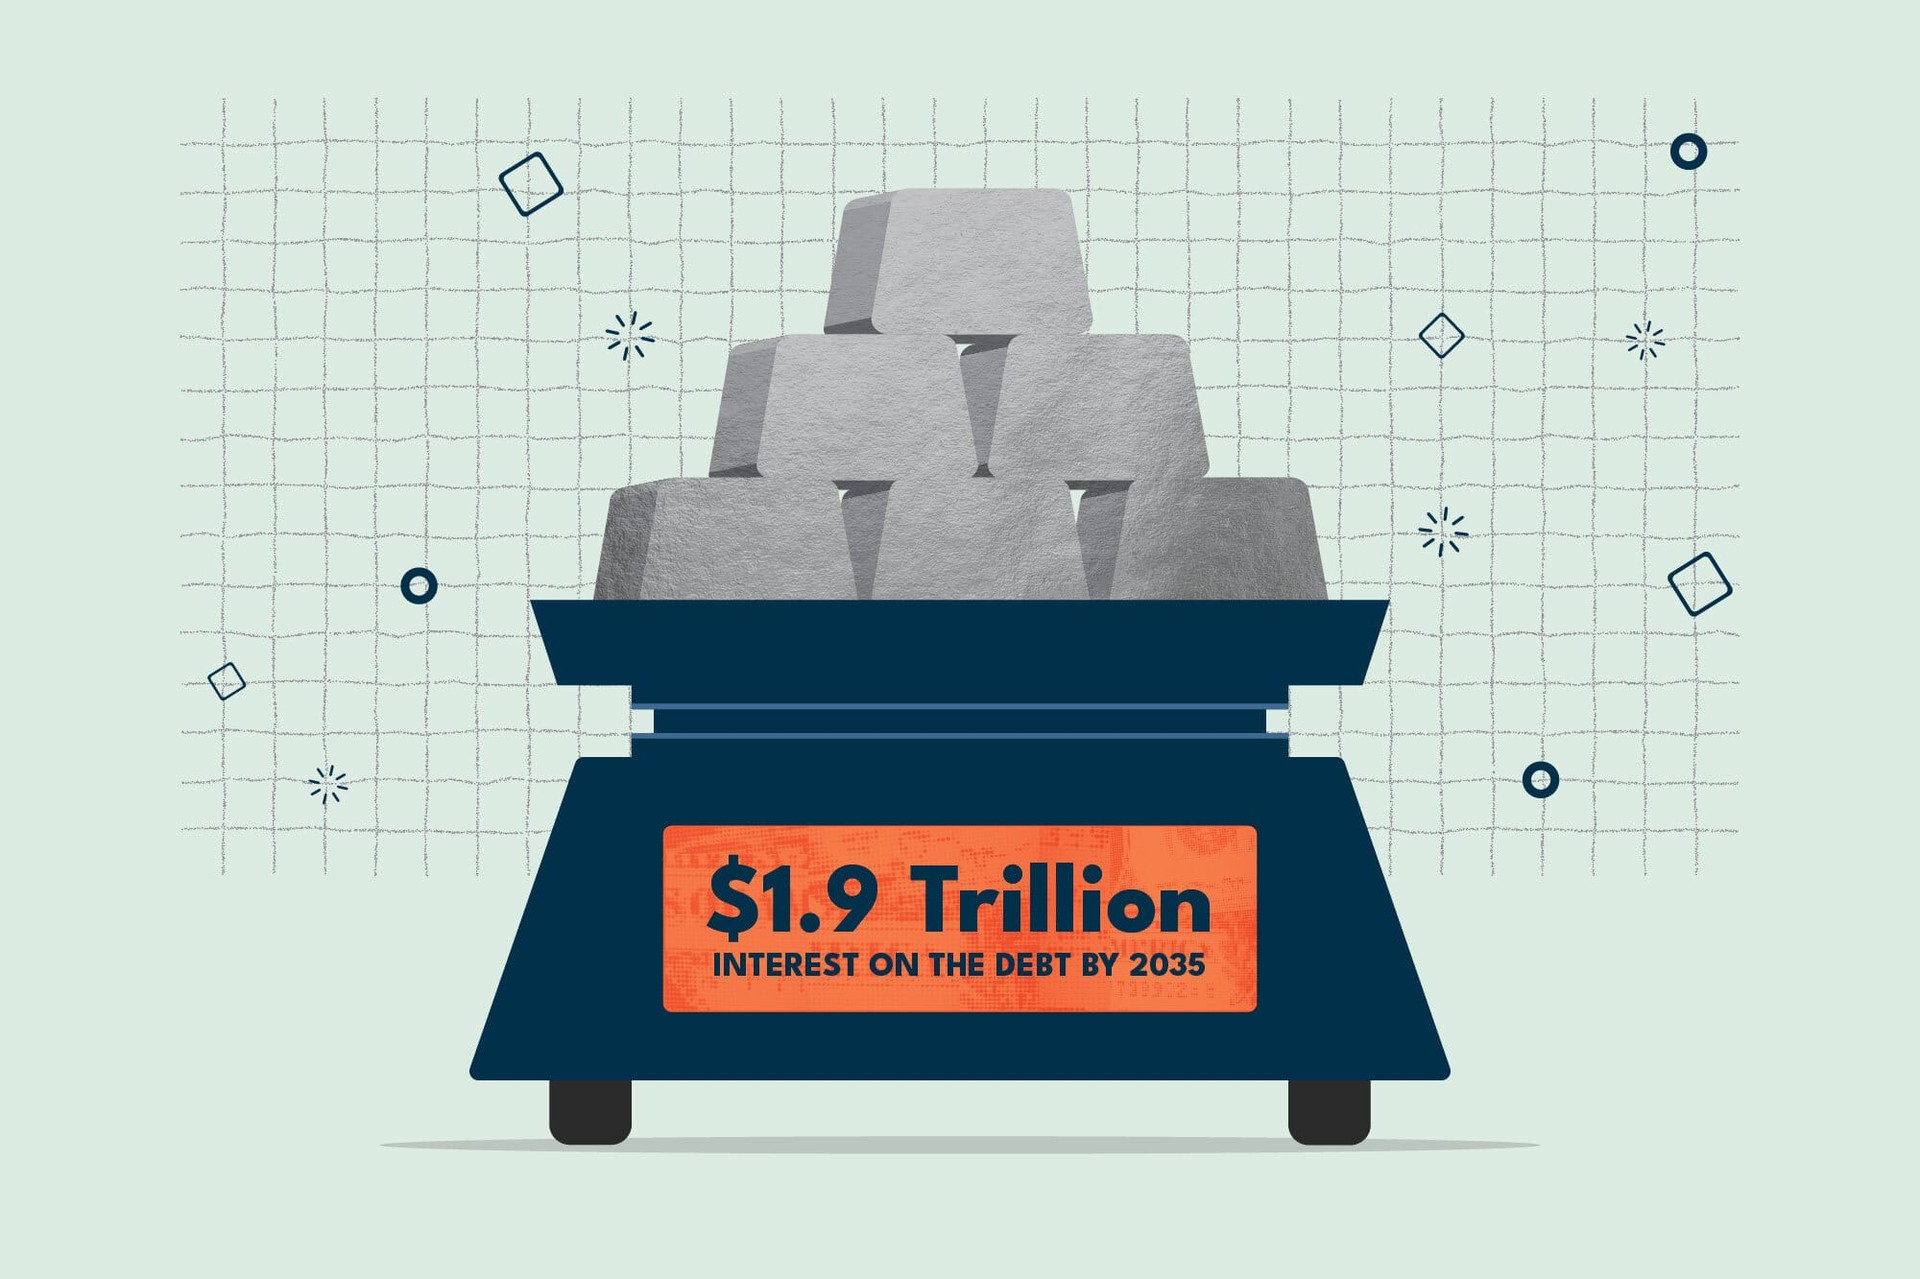
Interest spending on the debt is projected to be 4.4% of GDP ($1.924 trillion) by 2035.3 This total increased by 0.3% of GDP due to the One Big Beautiful Bill Act (OBBBA).4 A one-third percentage point may sound small, but it adds up to $141 billion in additional interest costs in 2035—almost as much as the amount the federal government is projected to spend on Affordable Care Act premium tax credits that year.5 In total, between now and 2035, we will need to pay $14.7 trillion in interest costs.6 For each additional dollar OBBBA added to the primary deficit, it added roughly $0.21 in interest costs.7 CBO officially scored OBBBA over the 2025-2034 budget window—a combined $4.1 trillion debt increase with $3.4 trillion in deficit increases and $718 billion in interest costs.8

Let’s look at interest spending over the long term. As the debt-to-GDP ratio increased in the 1980s and early 1990s, interest costs rose to between 3.0%-3.2% of GDP and remained high until the late 1990s when the national debt also began to decline.9 The combination of higher interest costs and increasing mandatory spending driven by Social Security and health care means that Congress simply has less control over how money is spent year-to-year. In 1974, the federal budget consisted of 8% interest costs, 41% mandatory, and 51% discretionary spending. In 2024, the federal budget was 13% interest costs, 60% mandatory, 27% discretionary.10 Even in the 1980s and 1990s when interest rates (and thus interest costs) were high, the rest of the budget was more balanced between mandatory and discretionary spending.11 By 2035, we project interest to be nearly 19% of all spending.12

Three Reasons Why High Interest Spending Hurts 

1. It shortchanges investment in future generations. Rising interest costs force today’s taxpayers to finance past decisions instead of investing in the future. As interest takes up more of the budget, pressure intensifies on the discretionary spending—the very spending which supports long-term national investments like infrastructure, research, and education. These programs rely on annual appropriations and annual decision-making, which makes them more likely to feel the squeeze than mandatory spending.  

Even a cross-cutting analysis of federal investment spending shows its decline in recent decades.13 The federal government averaged 21% of the budget on total investment spending in the 1960s and 12% of the budget in the 1970s before declining to less than 6% of the budget by 2024.14 All while interest spending, since 1962, more than doubled as a share of the budget from 6% to 13%.15

2. It squeezes out support for today’s children and families. The federal government now spends more on interest costs than on children.16 By 2034, spending on children will decline to 6% of the budget while interest costs increase to 17% in that year.17 Federal spending on children includes both mandatory and discretionary spending, tax credits that benefit families, and portions of major safety net programs like Medicaid and SNAP that are spent on benefits to children.

3. It weakens private-sector growth. Interest on the debt not only crowds out public investment, but it also crowds out private investment. Each additional percentage point in the debt-to-GDP ratio increases long-term interest rates between 1.5-4.7 basis points.18 In turn, higher interest rates discourage borrowing for private investment by as much as a third of each dollar of debt, reducing capital formation and economic output.19 Another way for private sector crowd-out is called portfolio substitution, where investors further divert capital from productive private-sector uses into safer government securities.20


Director of the Economic Program

Topics

Endnotes
  1. Debt held by the public on September 30, 2025, was $30.278 trillion, whereas gross national debt was $37.638 trillion. Gross national debt includes intergovernmental transfers. Net interest as a spending category is on debt held by the public. 

    United States Department of the Treasury, Final Monthly Treasury Statement: Receipts and Outlays of the United States Government for Fiscal Year 2025 Through September 30, 2025, Bureau of the Fiscal Service, 30 September 2025, https://fiscal.treasury.gov/files/reports-statements/mts/mts0925.pdf. Accessed 5 December 2025.

  2. United States Department of the Treasury, Monthly Treasury Statement of Receipts and Outlays of the United States Government for Fiscal Year 2024 Through September 30, 2024, Bureau of the Fiscal Service, 30 September 2024, https://fiscaldata.treasury.gov/static-data/published-reports/mts/MonthlyTreasuryStatement_202409.pdf. Accessed 5 December 2025. And; United States Department of the Treasury, Final Monthly Treasury Statement: Receipts and Outlays of the United States Government for Fiscal Year 2025 Through September 30, 2025, Bureau of the Fiscal Service, 30 September 2025, https://fiscal.treasury.gov/files/reports-statements/mts/mts0925.pdf. Accessed 5 December 2025. 

    The official Treasury data includes a more expansive definition of national defense spending and therefore provides a higher number than the Congressional Budget Office. CBO numbers for defense outlays were $855 billion in FY 2024 and $859 billion in FY 2025. 

    For comparison, see Congressional Budget Office. “The Budget and Economic Outlook: 2025 to 2035.” Congressional Budget Office, 17 January 2025, https://www.cbo.gov/publication/60870. Accessed 5 December 2025. 

  3. Third Way calculations based on Congressional Budget Office. “Effects on Deficits and the Debt of Public Law 119-21 and of Making Certain Tax Policies in the Act Permanent.” Congressional Budget Office, 4 August 2025, https://www.cbo.gov/system/files/2025-08/61466-DebtService.pdf. Accessed 5 December 2025. And; Congressional Budget Office. “The Budget and Economic Outlook: 2025 to 2035.” Congressional Budget Office, 17 January 2025, https://www.cbo.gov/publication/60870. Accessed 5 December 2025.

    Third Way’s calculations assume GDP levels from the January 2025 CBO baseline through 2035. (CBO released alternative GDP projections in September 2025, but the effects were modest and only provided revisions through 2028.) Numbers for new interest levels through 2034 were calculated using the most recent CBO estimate of the deficit and debt-servicing effects of OBBBA, and they were subsequently extrapolated to 2035. If interest rates remain higher than the CBO assumes, debt-servicing costs would be even higher.

  4. Third Way calculations based on Congressional Budget Office. “Effects on Deficits and the Debt of Public Law 119-21 and of Making Certain Tax Policies in the Act Permanent.” Congressional Budget Office, 4 August 2025, https://www.cbo.gov/system/files/2025-08/61466-DebtService.pdf. Accessed 5 December 2025. And; Congressional Budget Office. “The Budget and Economic Outlook: 2025 to 2035.” Congressional Budget Office, 17 January 2025, https://www.cbo.gov/publication/60870. Accessed 5 December 2025.

    Congressional Budget Office. “The Budget and Economic Outlook: 2025 to 2035.” Congressional Budget Office, 17 January 2025, https://www.cbo.gov/publication/60870. Accessed 5 December 2025.

  5. Third Way calculations based on Congressional Budget Office. “Effects on Deficits and the Debt of Public Law 119-21 and of Making Certain Tax Policies in the Act Permanent.” Congressional Budget Office, 4 August 2025, https://www.cbo.gov/system/files/2025-08/61466-DebtService.pdf. Accessed 5 December 2025. And; Congressional Budget Office. “The Budget and Economic Outlook: 2025 to 2035.” Congressional Budget Office, 17 January 2025, https://www.cbo.gov/publication/60870. Accessed 5 December 2025.

  6. Third Way calculations based on Congressional Budget Office. “Effects on Deficits and the Debt of Public Law 119-21 and of Making Certain Tax Policies in the Act Permanent.” Congressional Budget Office, 4 August 2025, https://www.cbo.gov/system/files/2025-08/61466-DebtService.pdf. Accessed 5 December 2025. And; Congressional Budget Office. “The Budget and Economic Outlook: 2025 to 2035.” Congressional Budget Office, 17 January 2025, https://www.cbo.gov/publication/60870. Accessed 5 December 2025.

  7. Third Way calculations based on Congressional Budget Office. “Effects on Deficits and the Debt of Public Law 119-21 and of Making Certain Tax Policies in the Act Permanent.” And; Congressional Budget Office, 4 August 2025, https://www.cbo.gov/system/files/2025-08/61466-DebtService.pdf. Accessed 5 December 2025.

  8. Congressional Budget Office. “Effects on Deficits and the Debt of Public Law 119-21 and of Making Certain Tax Policies in the Act Permanent.” Congressional Budget Office, 4 August 2025, https://www.cbo.gov/system/files/2025-08/61466-DebtService.pdf. Accessed 5 December 2025.

  9. Congressional Budget Office. “Historical Budget Data, Supplement to The Budget and Economic Outlook: 2025 to 2035.” Congressional Budget Office, 17 January 2025, https://www.cbo.gov/data/budget-economic-data#2. Accessed 5 December 2025.

  10. Peter G. Peterson Foundation, “Investment vs. Consumption: How Well are We Preparing for Our Future?” Peter G. Peterson Foundation, 7 June 2021, https://www.pgpf.org/article/investment-vs-consumption/. Accessed 5 December 2025.

  11. Congressional Budget Office. “Historical Budget Data, Supplement to The Budget and Economic Outlook: 2025 to 2035.” Congressional Budget Office, 17 January 2025, https://www.cbo.gov/data/budget-economic-data#2. Accessed 5 December 2025.

  12. Third Way calculations based on Congressional Budget Office. “Effects on Deficits and the Debt of Public Law 119-21 and of Making Certain Tax Policies in the Act Permanent.” And; Congressional Budget Office, 4 August 2025, https://www.cbo.gov/system/files/2025-08/61466-DebtService.pdf. Accessed 5 December 2025. And; Congressional Budget Office. “Estimated Budgetary Effects of Public Law 119-21, to Provide for Reconciliation Pursuant to Title II of H. Con. Res. 14, Relative to CBO’s January 2025 Baseline, As enacted on July 4, 2025.” Congressional Budget Office, 21 July 2025, https://www.cbo.gov/publication/61570. Accessed 5 December 2025.

    Numbers for new interest levels and total outlay levels through 2034 were calculated using the most CBO estimates of OBBBA, and they were subsequently extrapolated to 2035.

    An alternative baseline released by the Committee for a Responsible Federal Budget post-OBBBA projects that interest costs will reach 17% of federal spending by 2035. This baseline assumes that revenues collected from Trump administration tariff policies will continue, however, and that overall interest costs are slightly lower. 

    For more information, see Committee for a Responsible Federal Budget. “An August 2025 Budget Baseline.” CRFB Blog, 20 August 2025, https://www.crfb.org/blogs/august-2025-budget-baseline. Accessed 10 November 2025.

  13. Congressional Budget Office, Federal Investment, 1962 to 2018, Congressional Budget Office, 27 June 2019, https://www.cbo.gov/publication/55375. Accessed 5 December 2025.

  14. Office of Management and Budget. “Table 9.1— Total Investment Outlays for Physical Capital, Research and Development, and Education and Training: 1962–2024.” Office of Management and Budget, 9 Mar. 2023, https://www.whitehouse.gov/omb/budget/. Accessed 5 December 2025.

    For comparison, the federal government averaged 5.8% of GDP on total investment spending in the 1960s and 4.4% of GDP in the 1970s before declining to 2.4% of GDP by 2018.

    See Congressional Budget Office, Federal Investment, 1962 to 2018, Congressional Budget Office, 27 June 2019, https://www.cbo.gov/publication/55375. Accessed 5 December 2025.

  15. Congressional Budget Office. “Historical Budget Data, Supplement to The Budget and Economic Outlook: 2025 to 2035.” Congressional Budget Office, 17 January 2025, https://www.cbo.gov/data/budget-economic-data#2. Accessed 5 December 2025.

  16. Committee for a Responsible Federal Budget, “Interest Overtakes Kids’ Spending,” CRFB, 17 May 2023, https://www.crfb.org/blogs/interest-overtakes-kids-spending. Accessed 5 December 2025.

  17. Hahn, Heather, Phillips, Eden, Nikolopoulos, Elli, Casas, Michelle, Lou, Cary, Steuerle, C. Eugene, and Daly, Hannah, Kids’ Share 2024: Report on Federal Expenditures on Children through 2023 and Future Projections, Urban Institute, September 2024, https://www.urban.org/sites/default/files/2024-10/Kids-Share-2024_0.pdf. Accessed 5 December 2025.

  18. Peter G. Peterson Foundation, “The Rising National Debt Drives Up Interest Rates,” Peter G. Peterson Foundation, 9 July 2024, https://www.pgpf.org/article/the-rising-national-debt-drives-up-interest-rates/. Accessed 5 December 2025.

  19. Congressional Budget Office, Effects of Physical Infrastructure Spending on the Economy and the Budget Under Two Illustrative Scenarios, Congressional Budget Office, August 2021, https://www.cbo.gov/publication/57407. Accessed 5 December 2025. And; Peter G. Peterson Foundation, “The National Debt Can Crowd Out Investments in the Economy — Here’s How,” Peter G. Peterson Foundation, 23 April 2025, https://www.pgpf.org/article/the-national-debt-can-crowd-out-investments-in-the-economy-heres-how/. Accessed 5 December 2025.

  20. Penn Wharton Budget Model, “Explainer: Capital Crowd Out Effects of Government Debt,” Penn Wharton Budget Model, 28 June 2021, https://budgetmodel.wharton.upenn.edu/issues/2021/6/28/explainer-capital-crowd-out-effects-of-government-debt. Accessed 5 December 2025.

Subscribe
Get updates whenever new content is added. We'll never share your email with anyone.

Downloads

pdf

Share