Infographic Published June 25, 2025 · 1 minute read
The Numbers Behind Immigrant-Owned Small Businesses
Rachel Evans & Madeline Burke

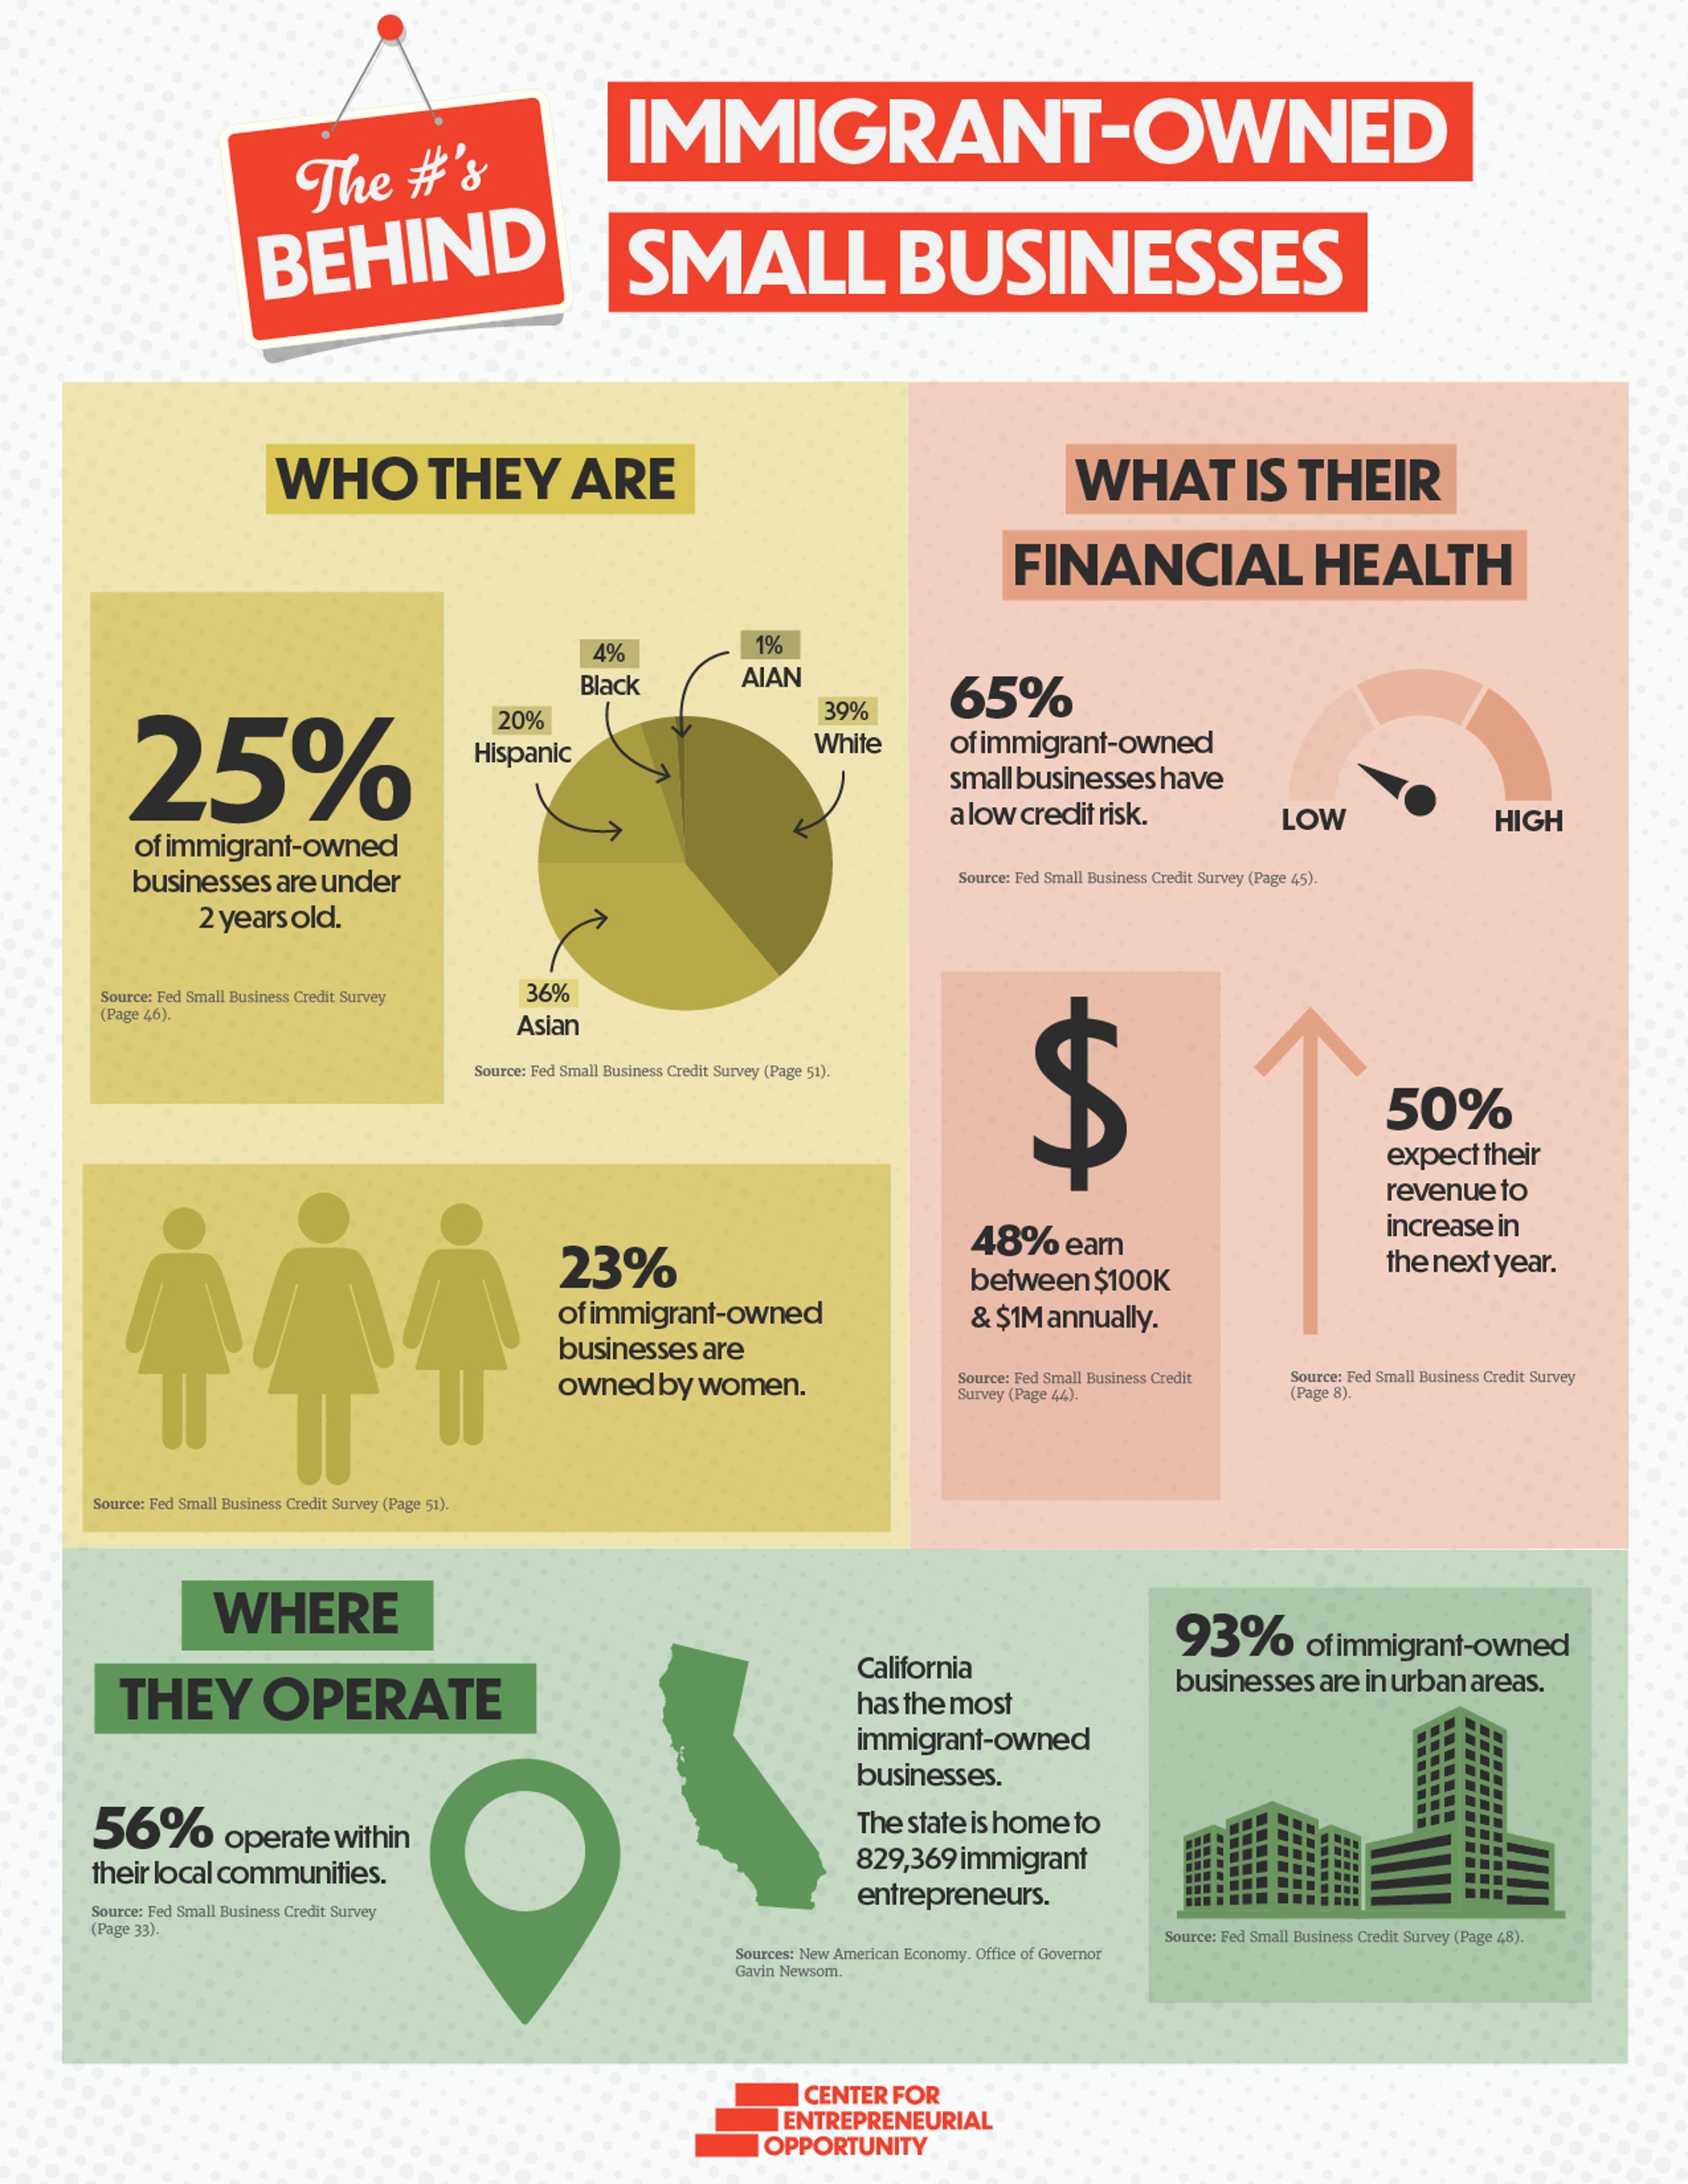
From the mom-and-pop restaurant down the street to the corner store that knows your name, immigrant-owned small businesses shape our communities. These businesses don’t just contribute to the economy—they create spaces where neighbors share new flavors, stories, and ideas. Across the country, immigrant entrepreneurs are boosting innovation, growing businesses, and supporting jobs. This infographic draws on data from the Federal Reserve's 2025 Small Business Credit Survey to offer a snapshot of the faces behind immigrant-owned businesses, the communities they serve, and their financial health. The data reflects responses from businesses that are majority immigrant-owned, defined as having at least 51% ownership by individuals born outside the US. Explore key stats and insights to better understand the role of immigrant entrepreneurship in strengthening local economies.